Find real numbers
Extract statistics and surrounding context before choosing what deserves a visual.
Extract statistics from reports, articles, and documents, then create branded visuals that make the number clear and trustworthy.
Give important numbers a polished visual treatment without separating them from the source.
Built for marketers, researchers, analysts, and educators, starting from reports, pdfs, articles, or pasted research.

Use-case fit
Create source-backed stat cards from reports, PDFs, articles, and research documents for social and presentation use.
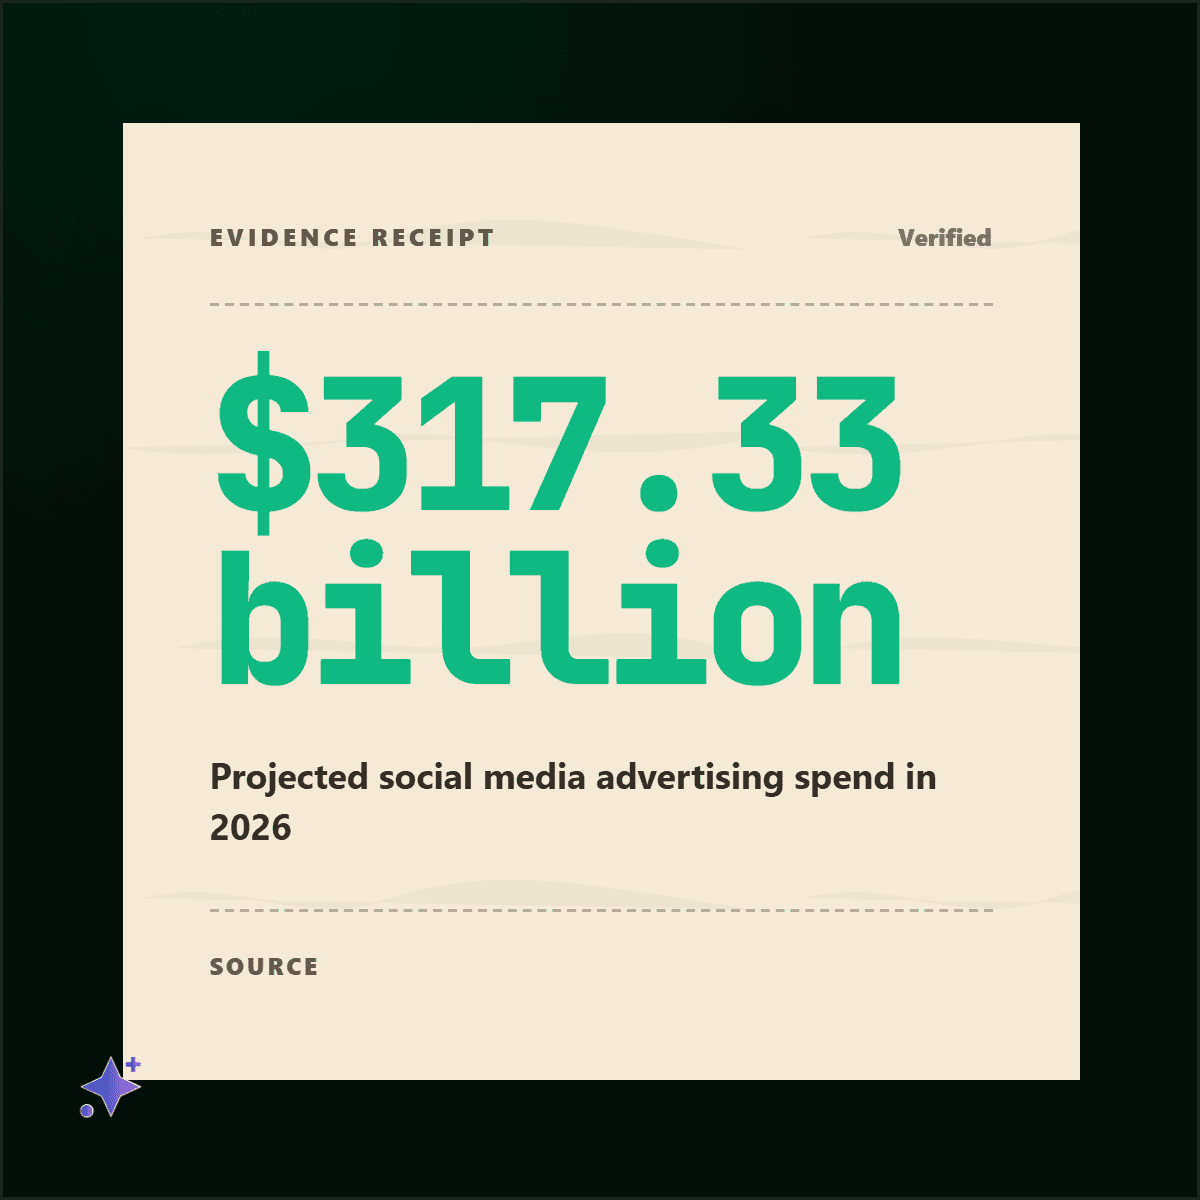
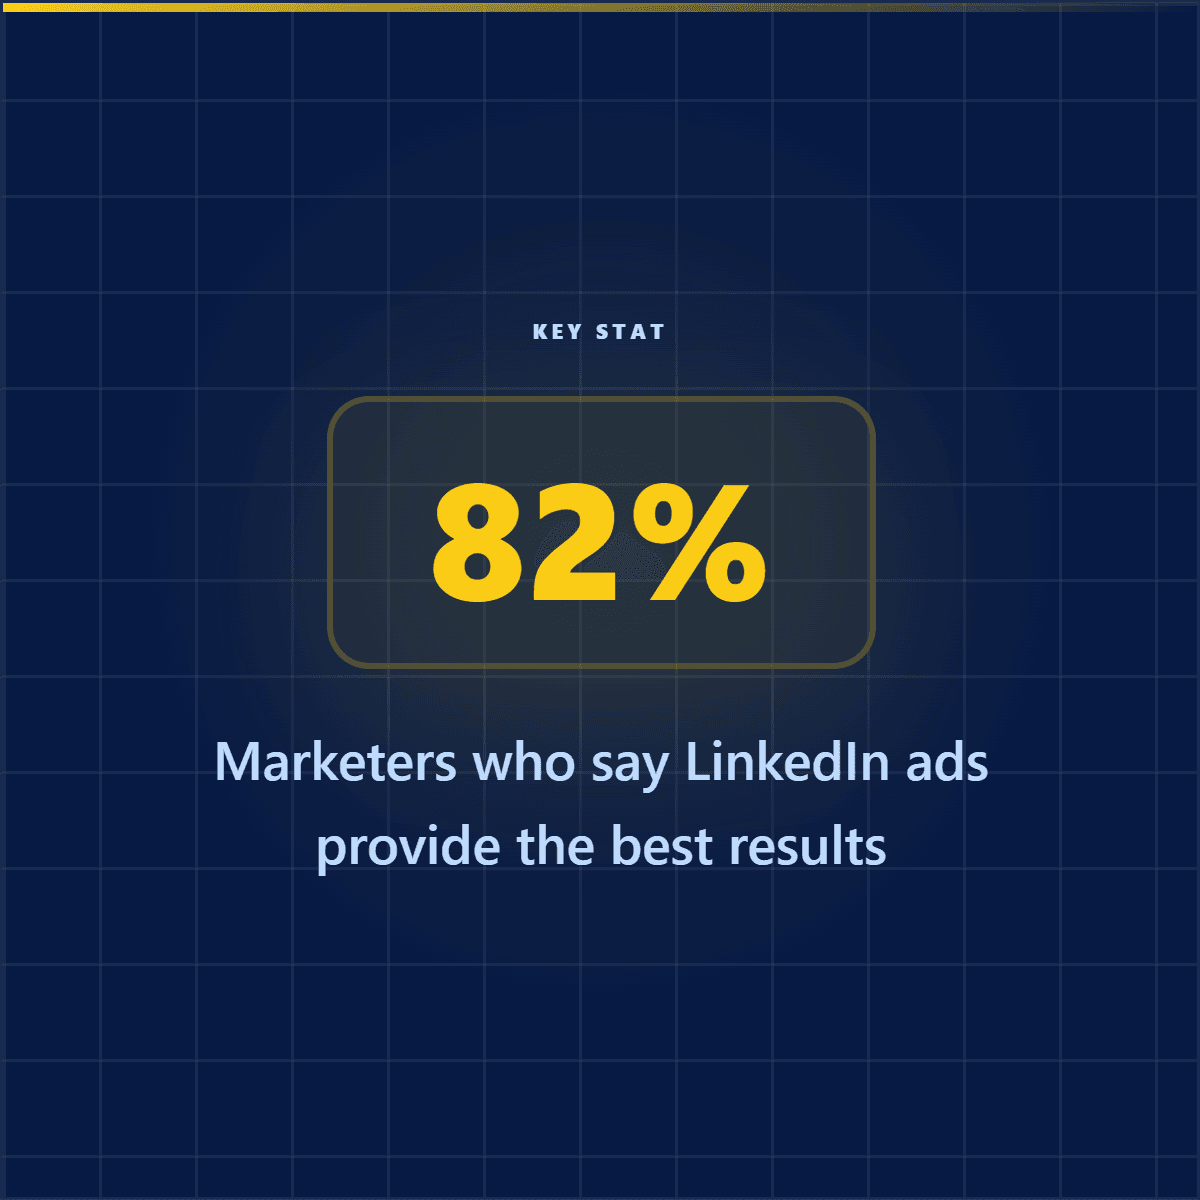
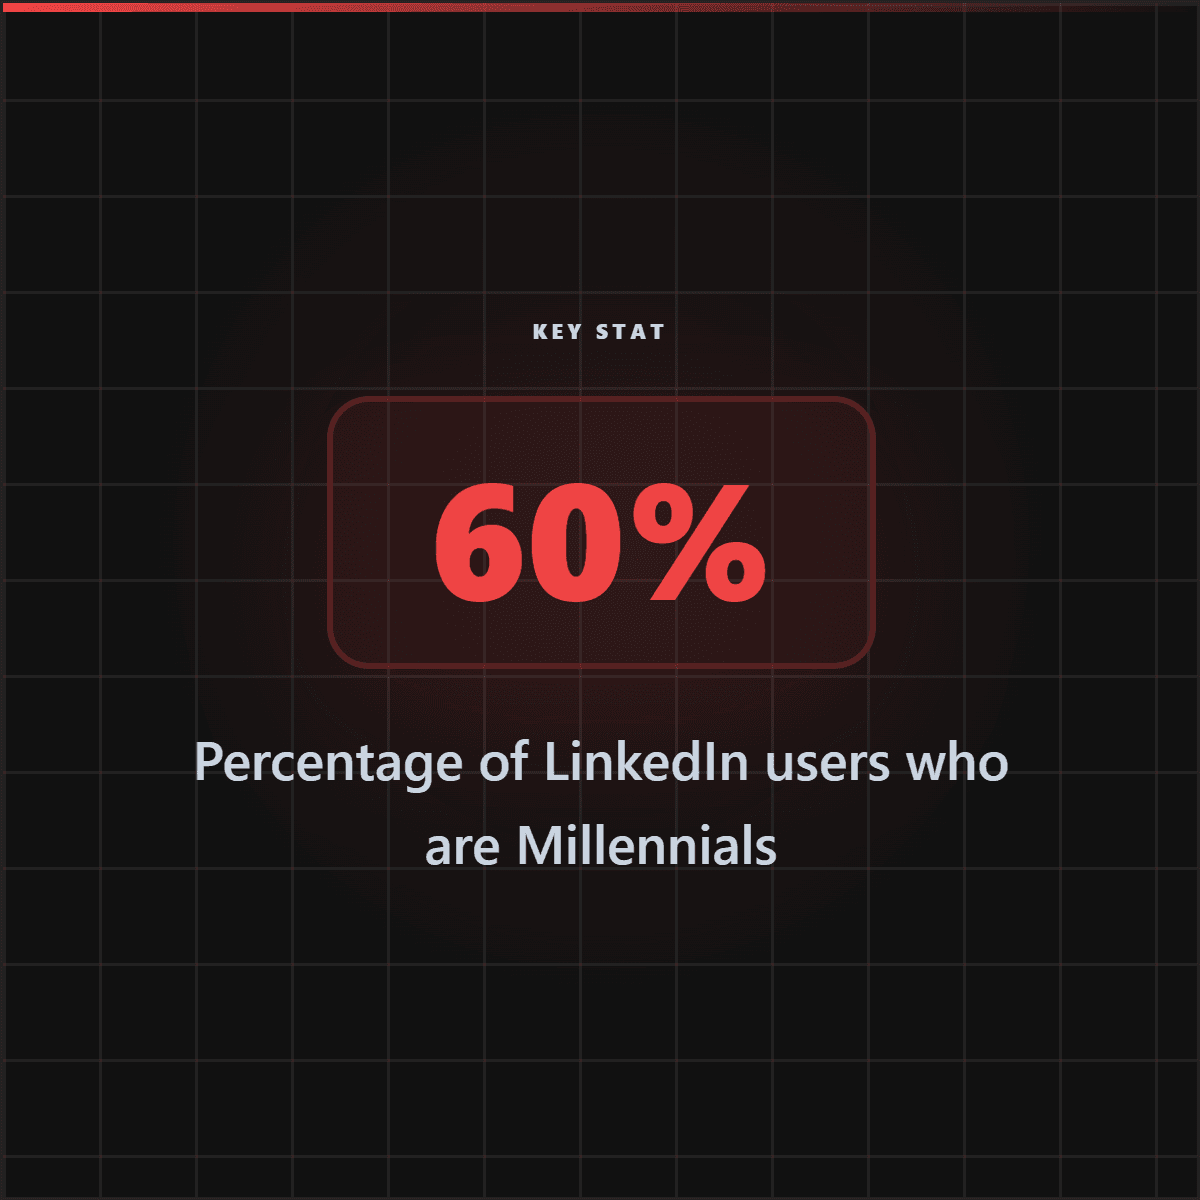
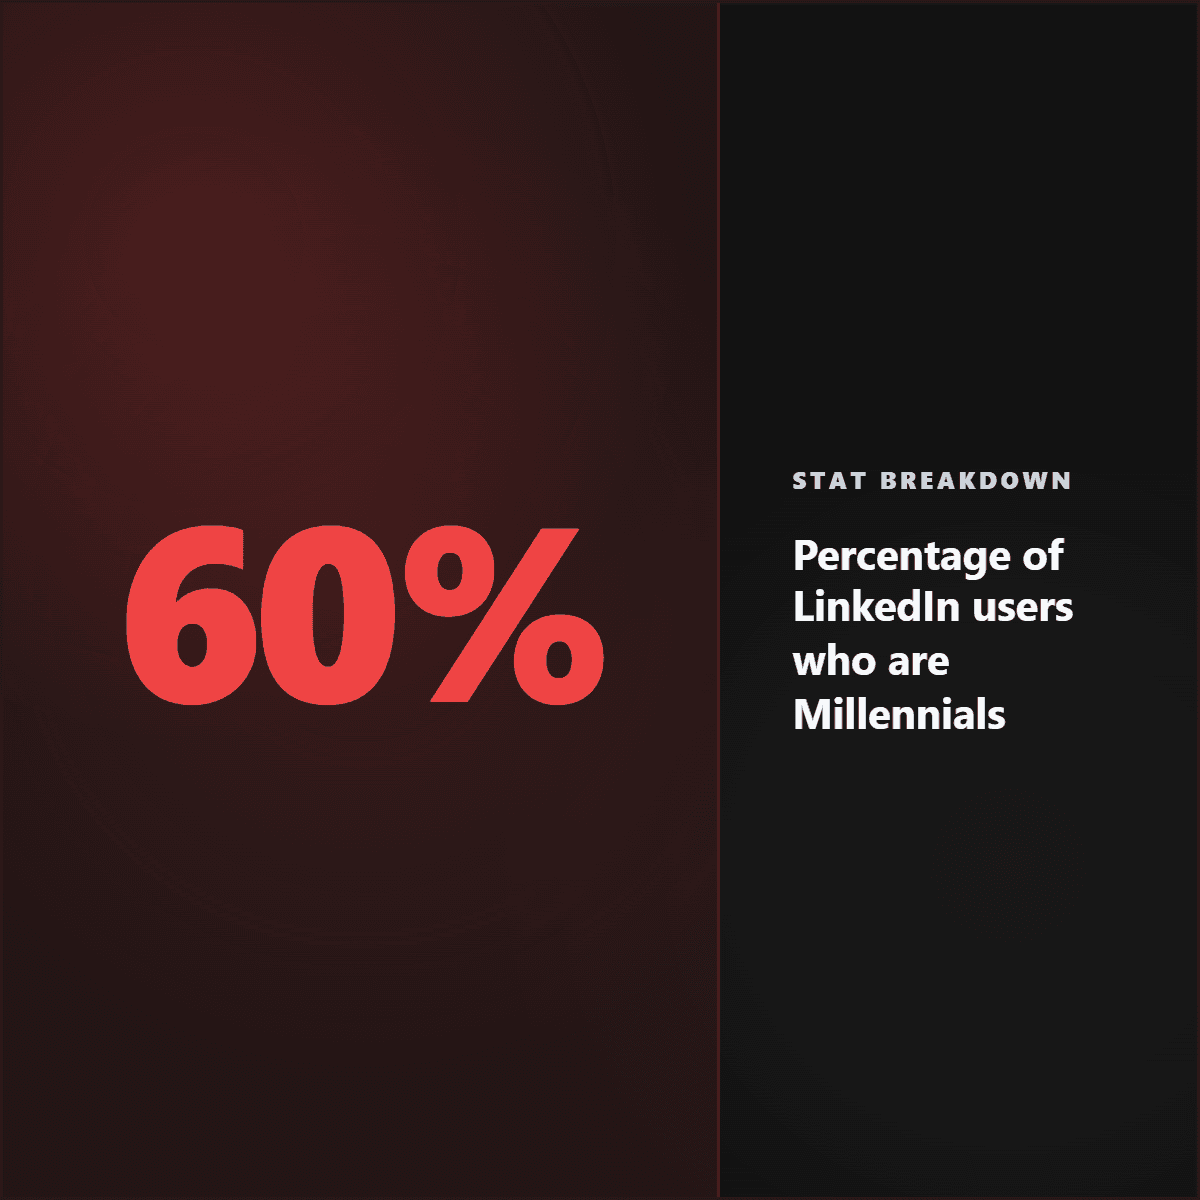
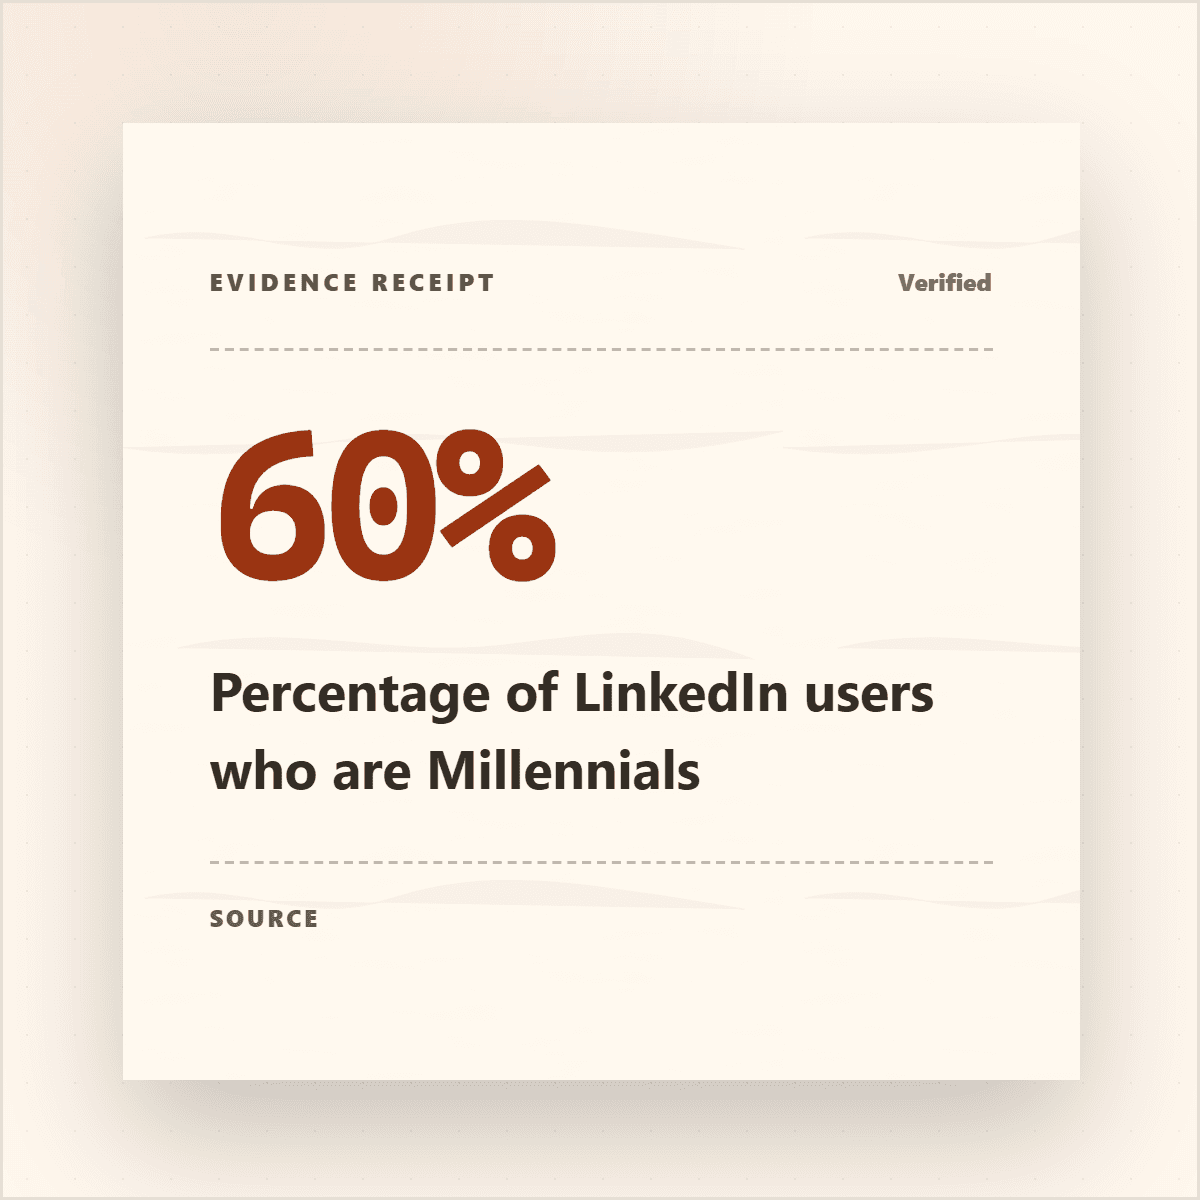
These Highlightly stat cards show how extracted statistics can become branded proof assets without losing the source-backed nature of the claim.


How it works
Start from a PDF report, article URL, pasted excerpt, research note, or document upload so the number stays connected to its original context.
Use Highlightly's extracted statistics, facts, source metadata, and related key points to verify which numbers are strong enough to publish.
Create big-number cards, stat receipts, editorial stat panels, briefing slides, or carousel stat pages, then tune typography, hierarchy, and source labels.
Use Brand Kit controls and ratio exports to create square feed posts, vertical story graphics, and 16:9 deck-ready stat visuals from the same proof point.
What you control
Source-backed extraction, customization, and export polish in one workflow.
Extract statistics and surrounding context before choosing what deserves a visual.
Use big-number, receipt, editorial, briefing, and carousel treatments with source labels.
Create square, vertical, and landscape graphics from the same stat.
Outputs
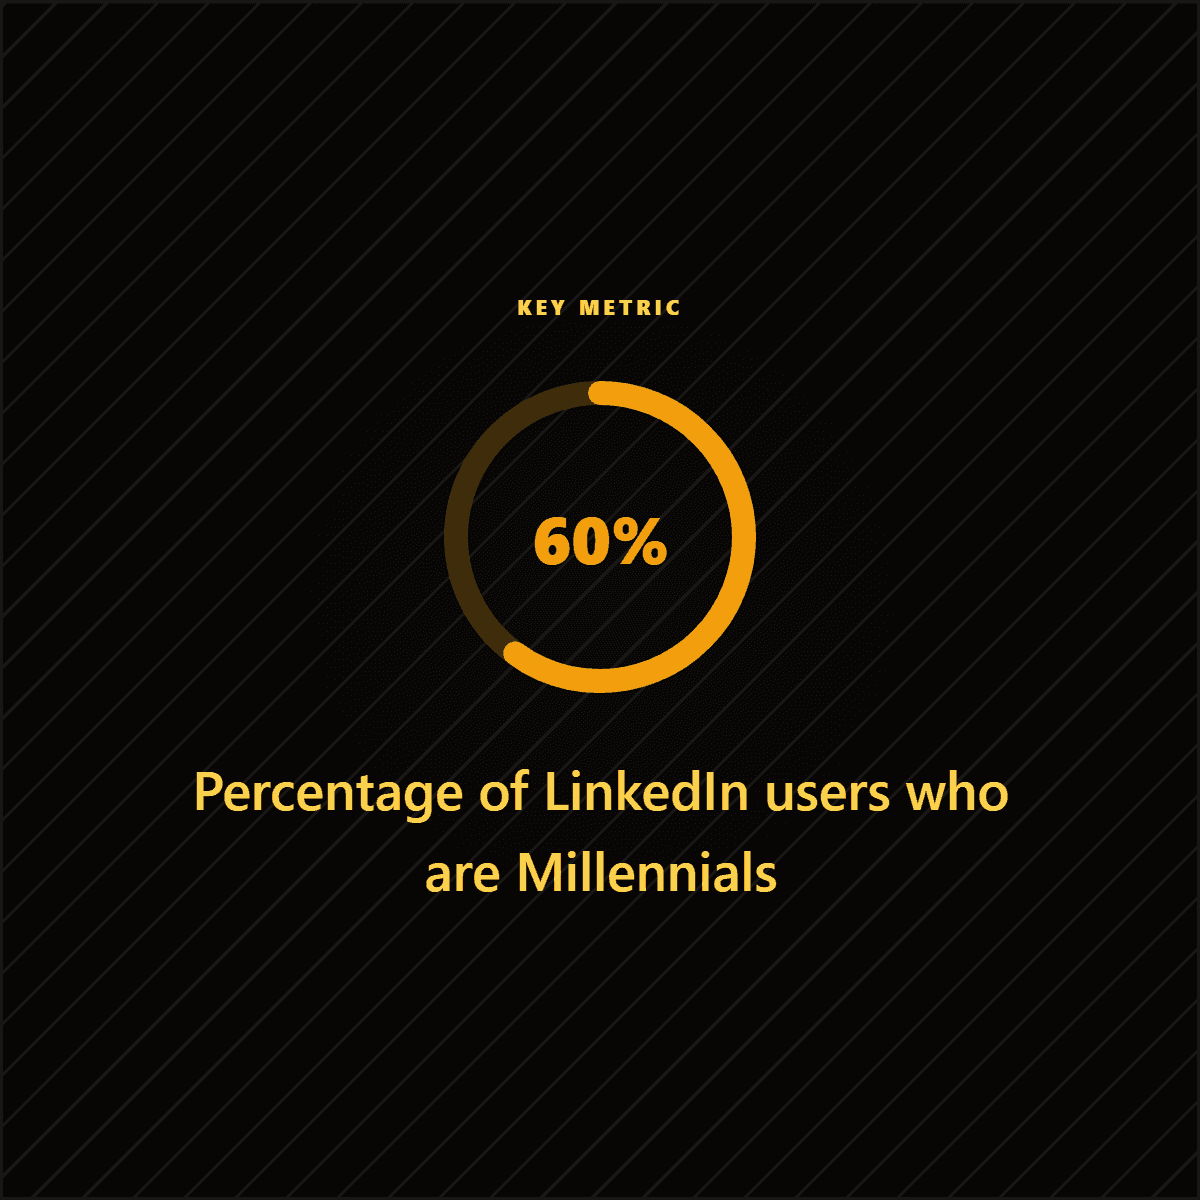
A single number becomes a clear feed asset.
Related findings become one compact visual.
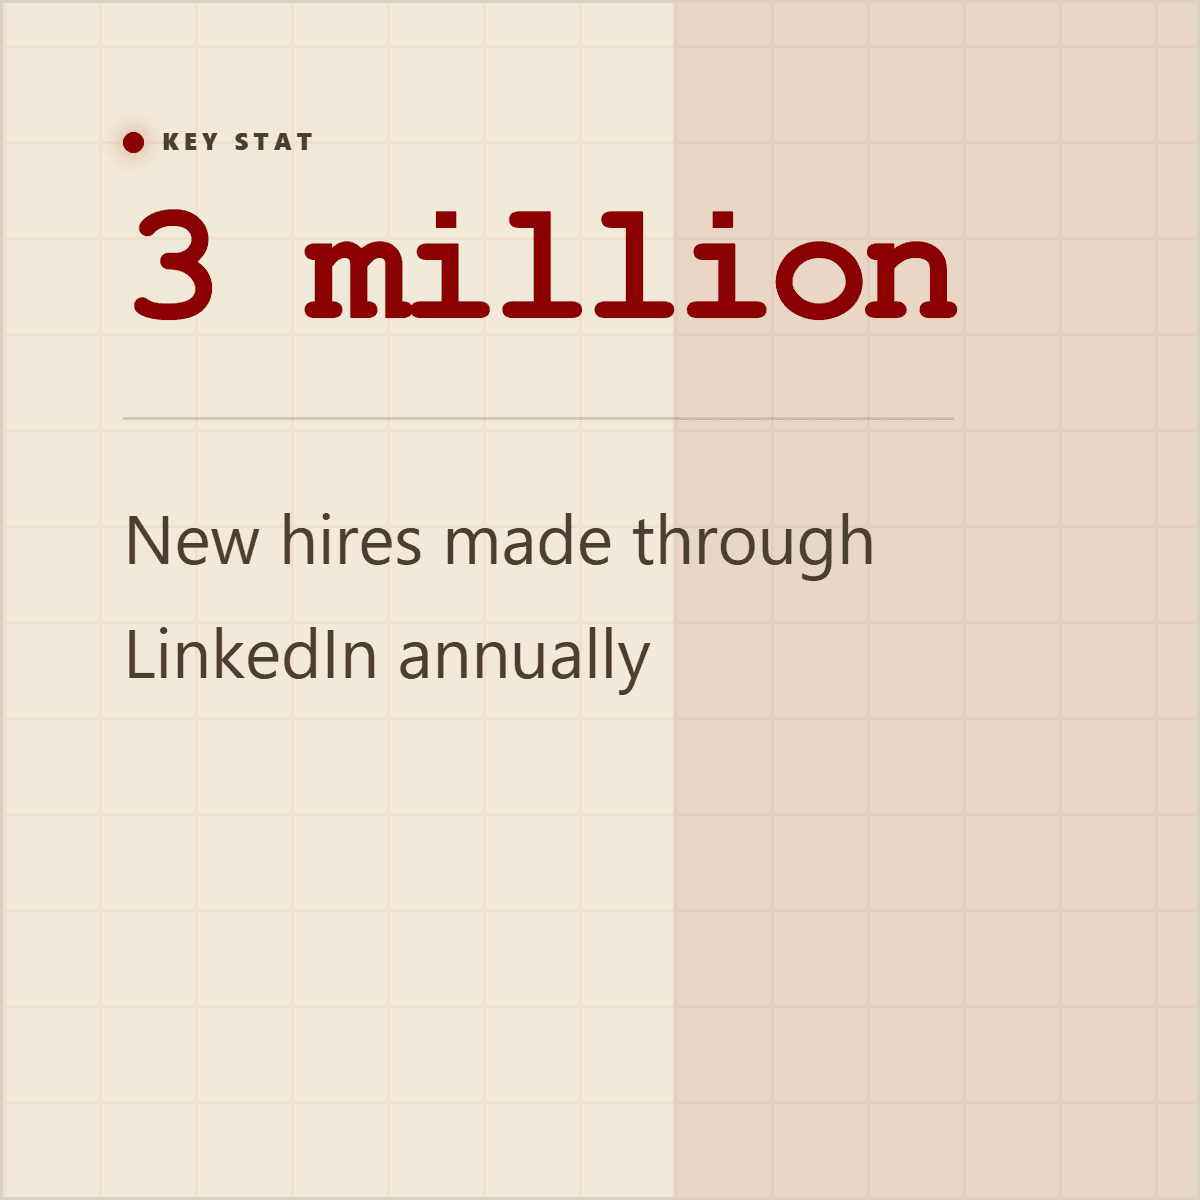
A cited number becomes a 16:9 presentation visual.
Included surfaces
The product promise stays anti-slop: start from real source material, expose what was extracted, edit the creative direction, then export.
No. It extracts source material and gives you a review surface; you should verify important claims before publishing.
Yes. You can adjust templates, brand kit, colors, and export ratio.
Yes. This workflow can start from reports, PDFs, articles, pasted research, and document uploads.
Try the workflow
Review the extracted material, choose the output, apply your brand kit, and export with source context still available.