Turn any statistic into a scroll-stopping stat card.
Paste an article or report URL. AI finds every number. Pick one. Download a branded graphic with source attribution.
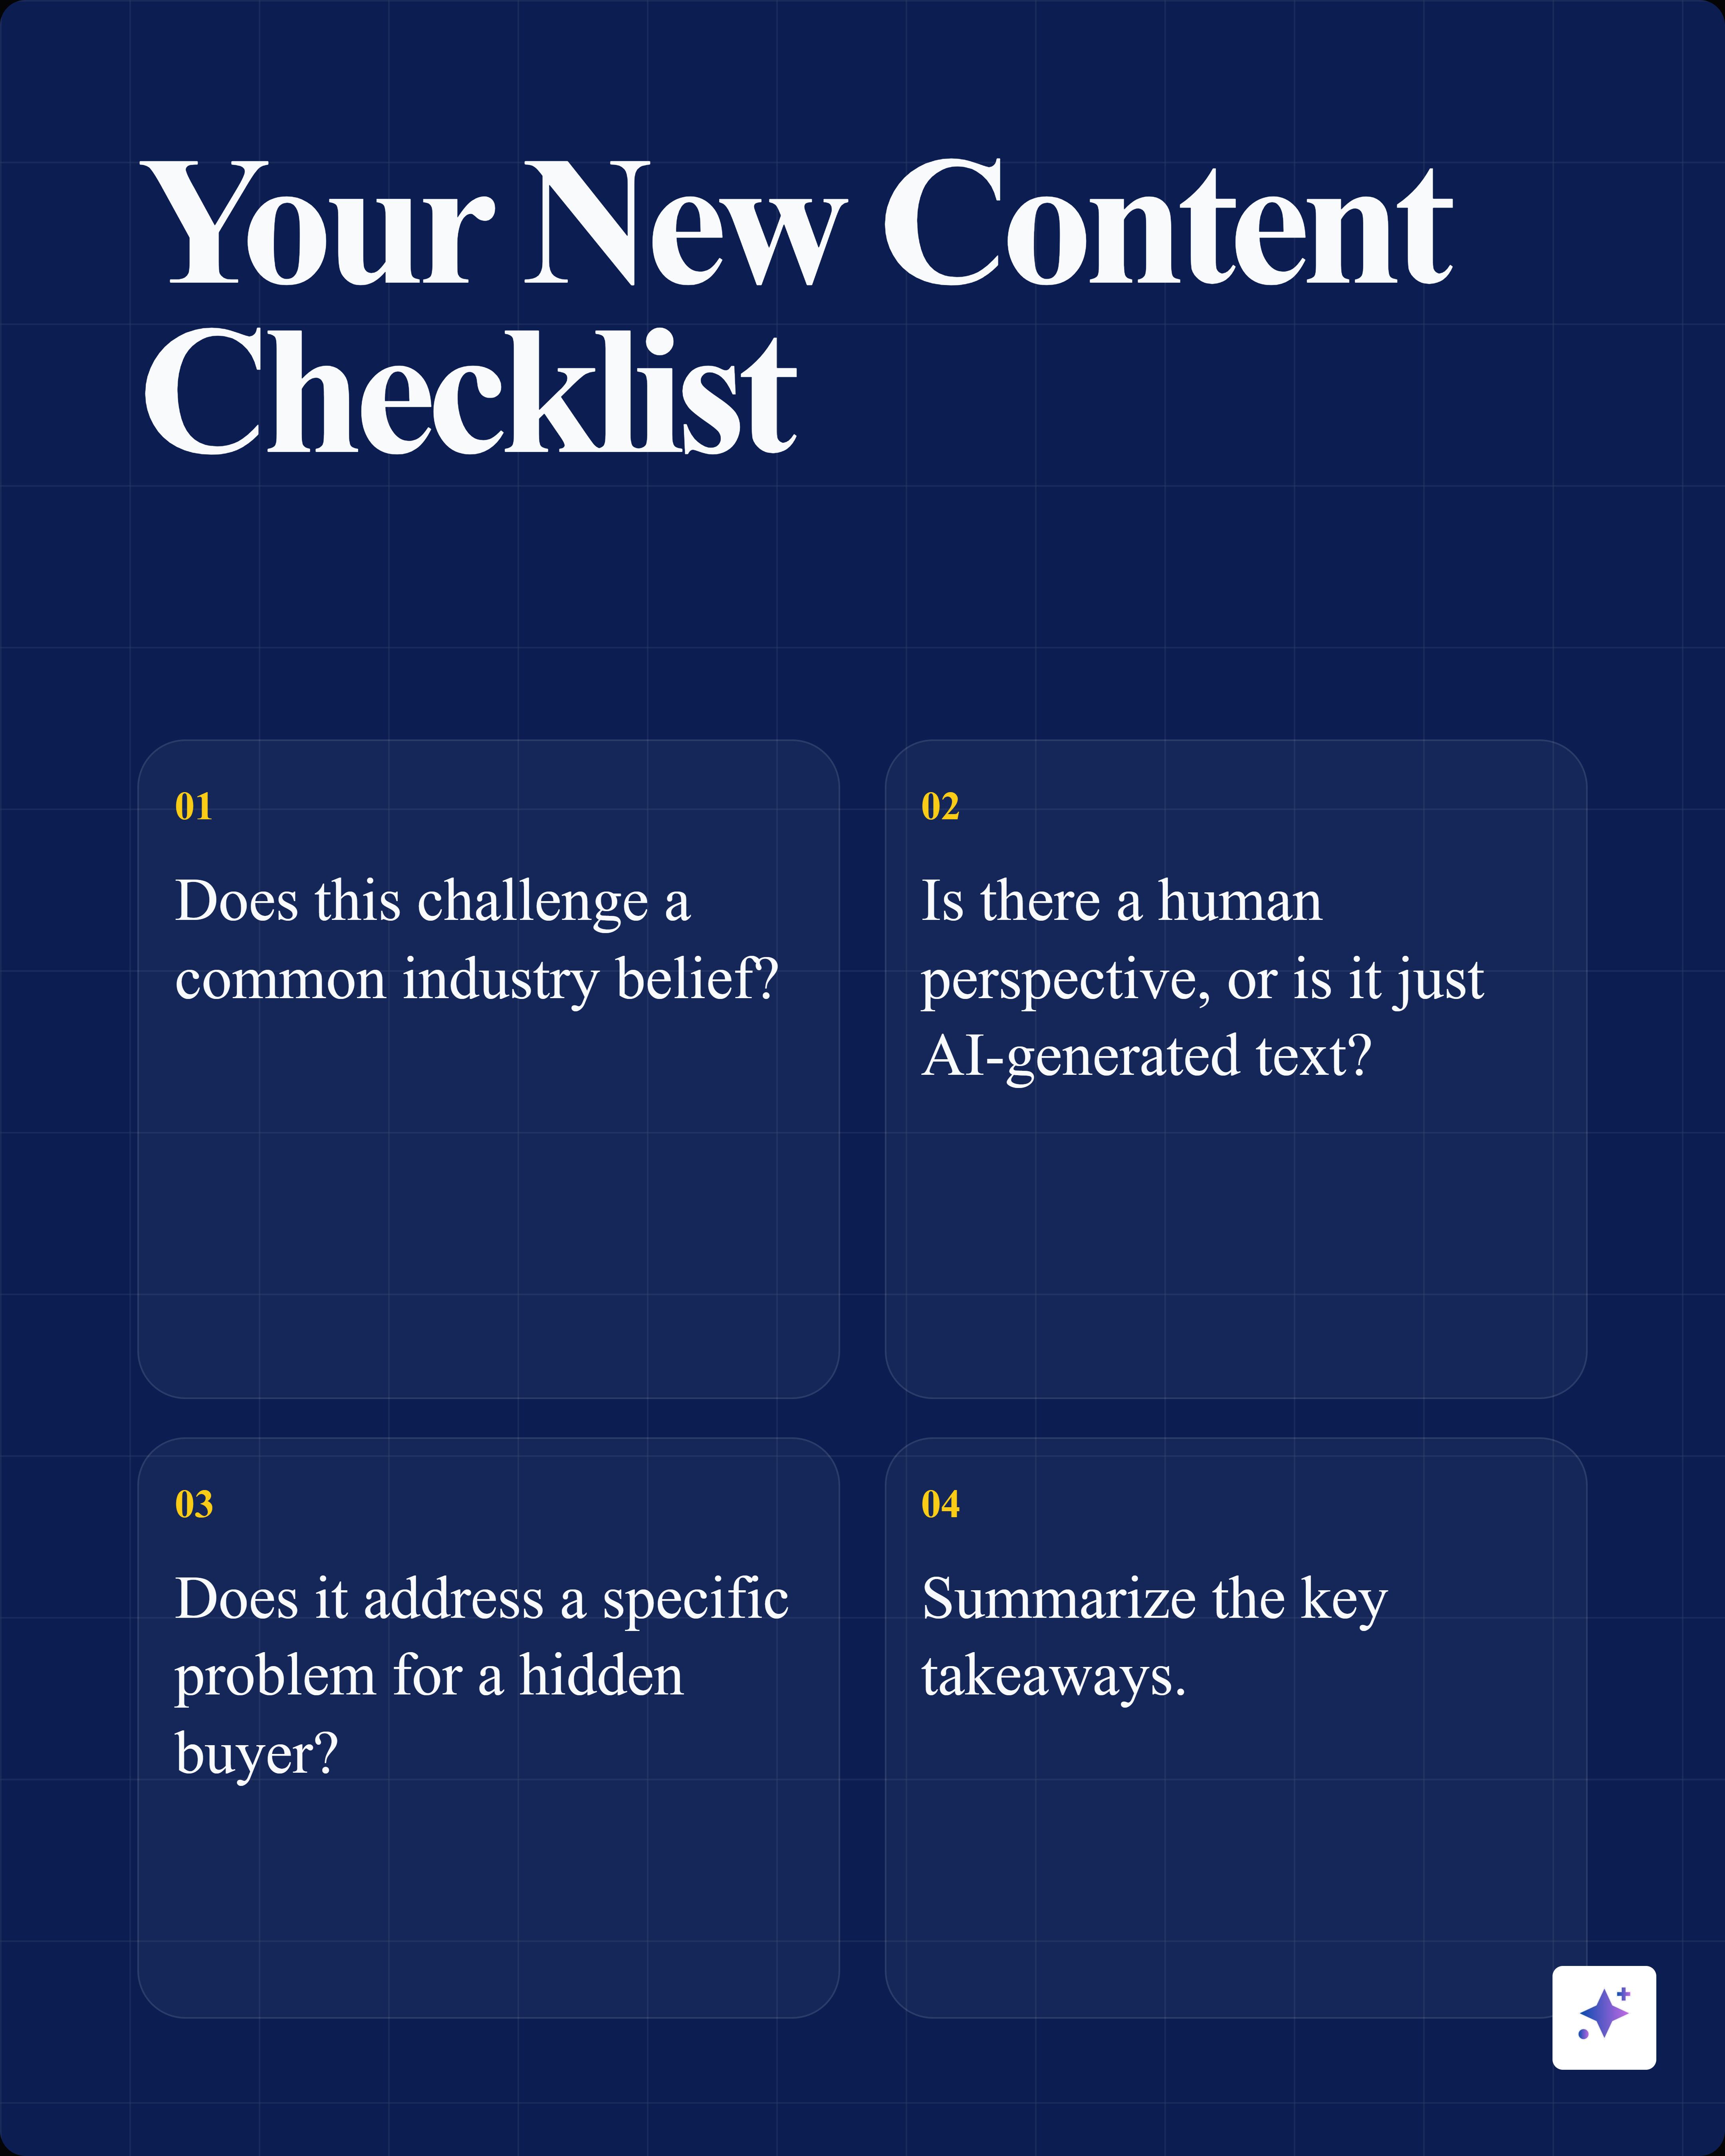
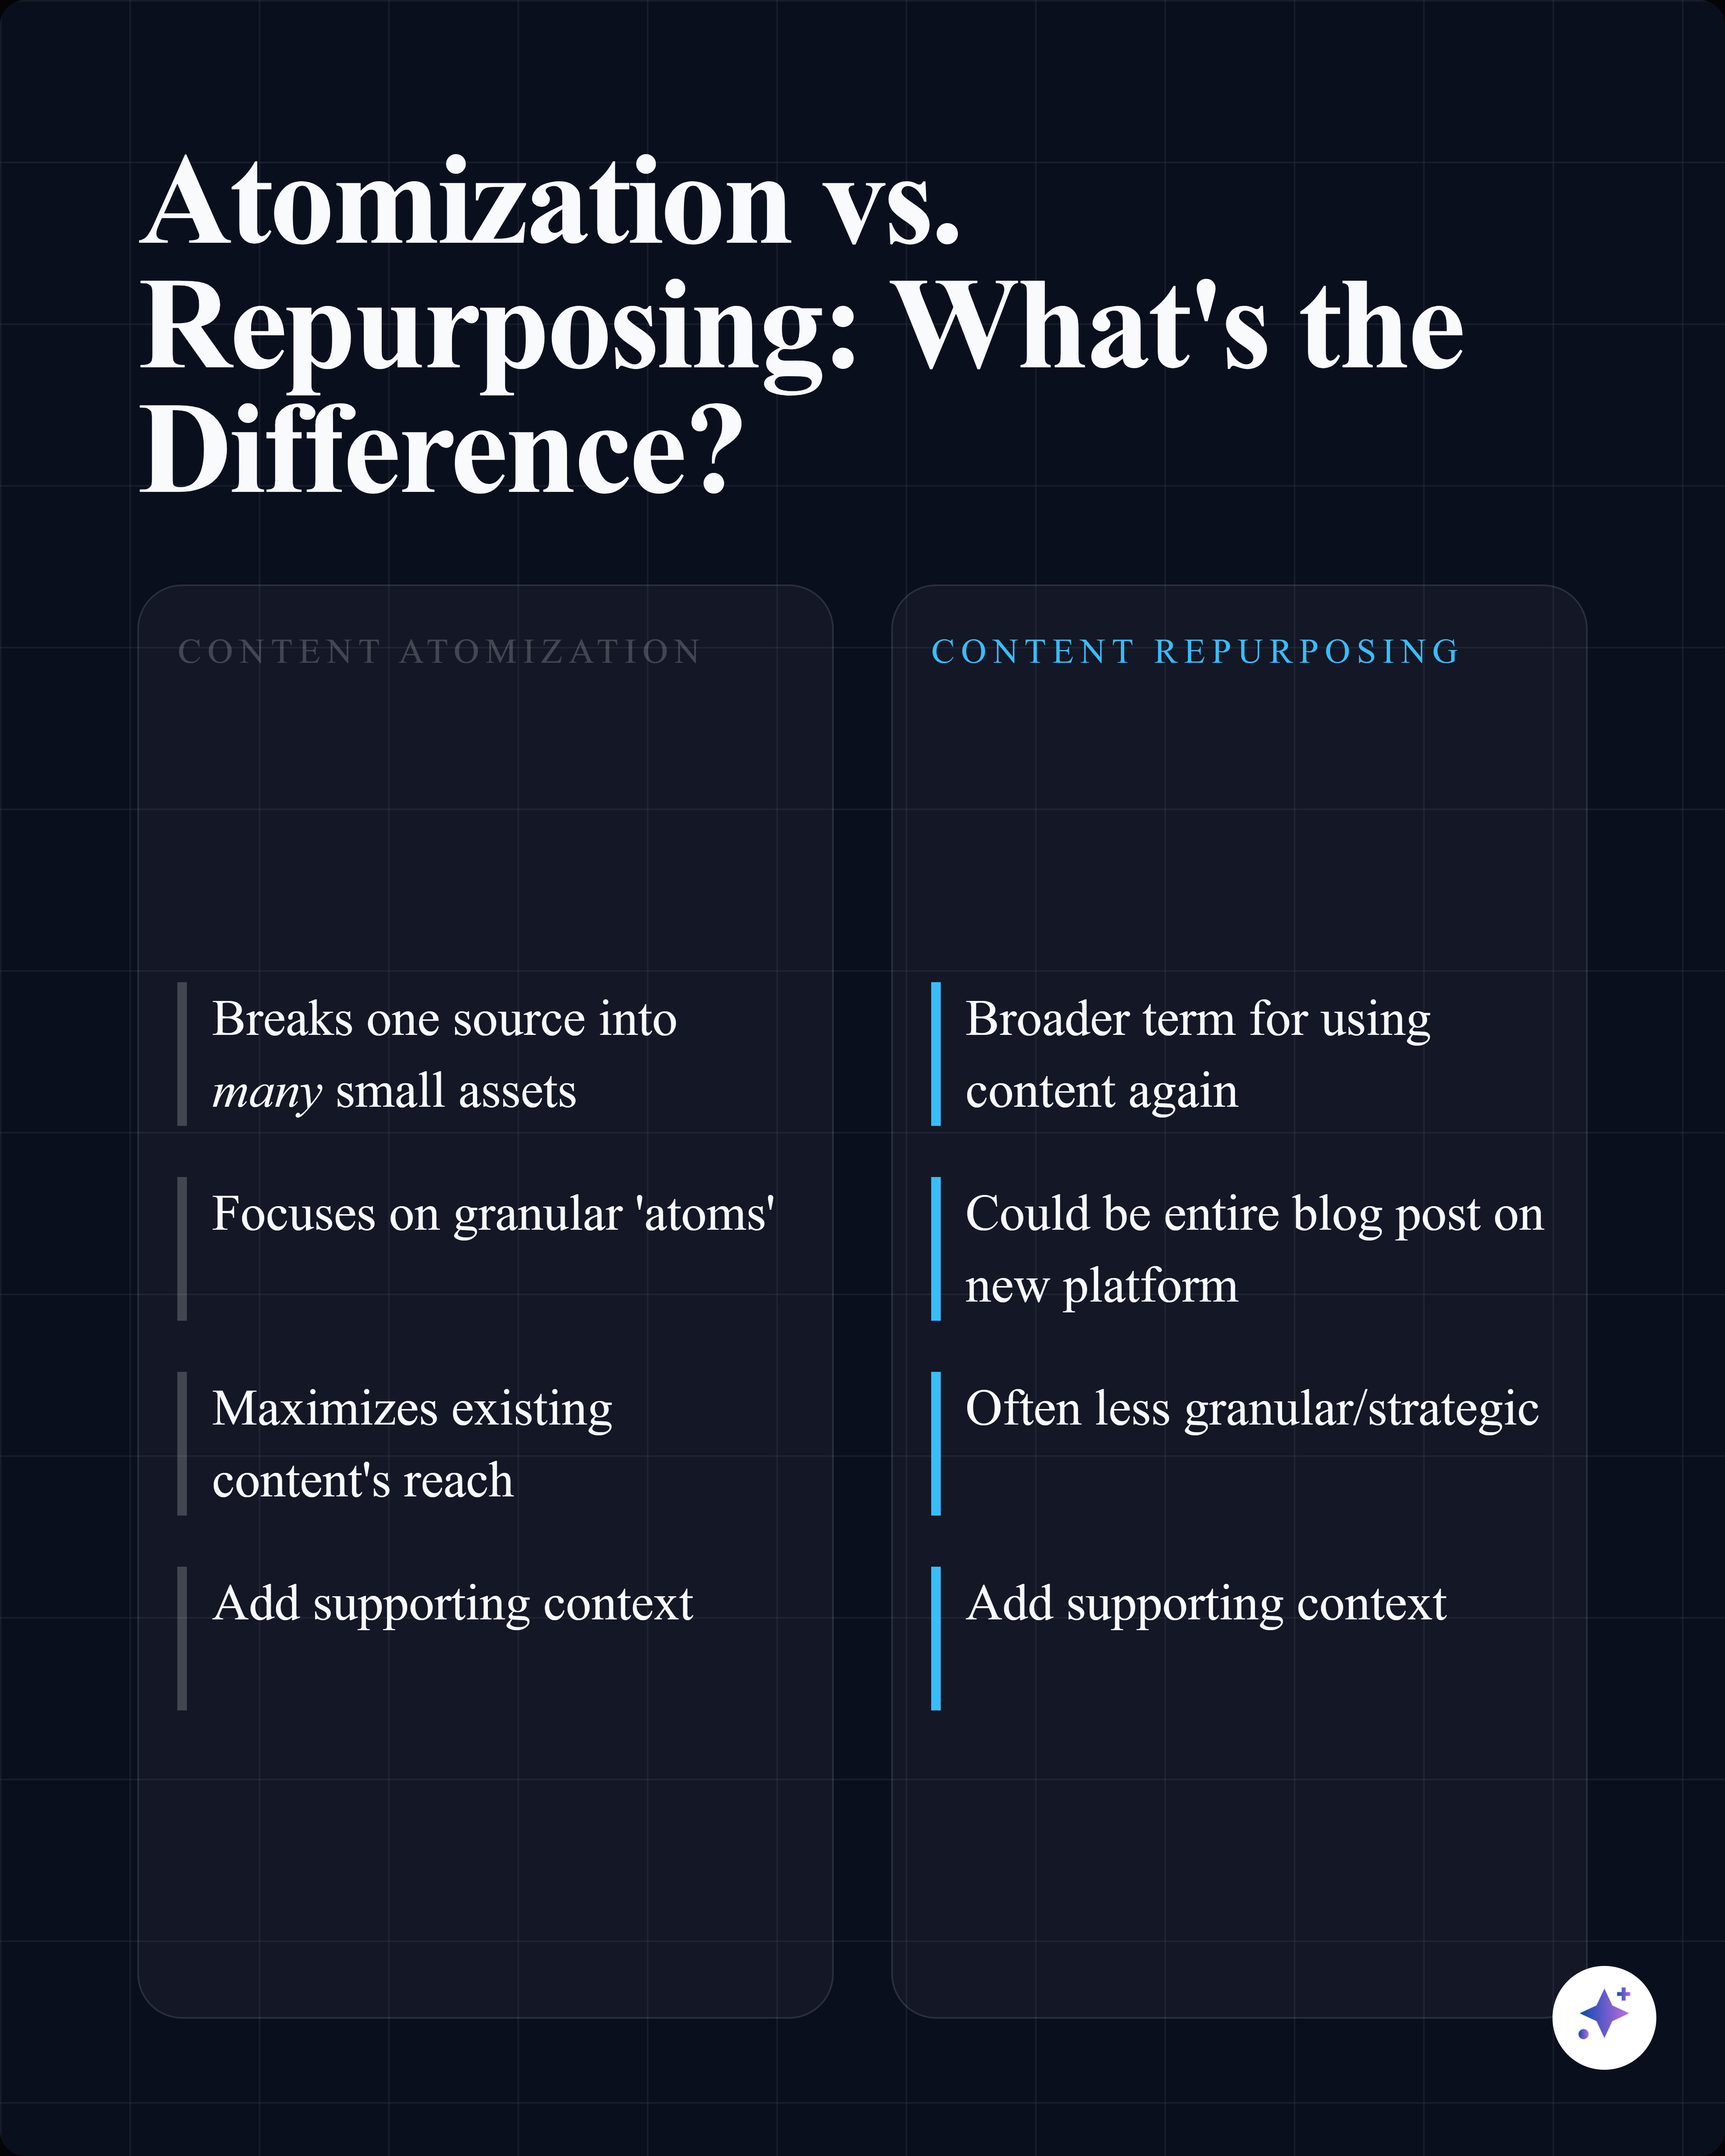
4 visual styles
Choose the style that fits your story.
Every stat can be rendered in four distinct visual formats. Pick the one that matches your audience and platform.
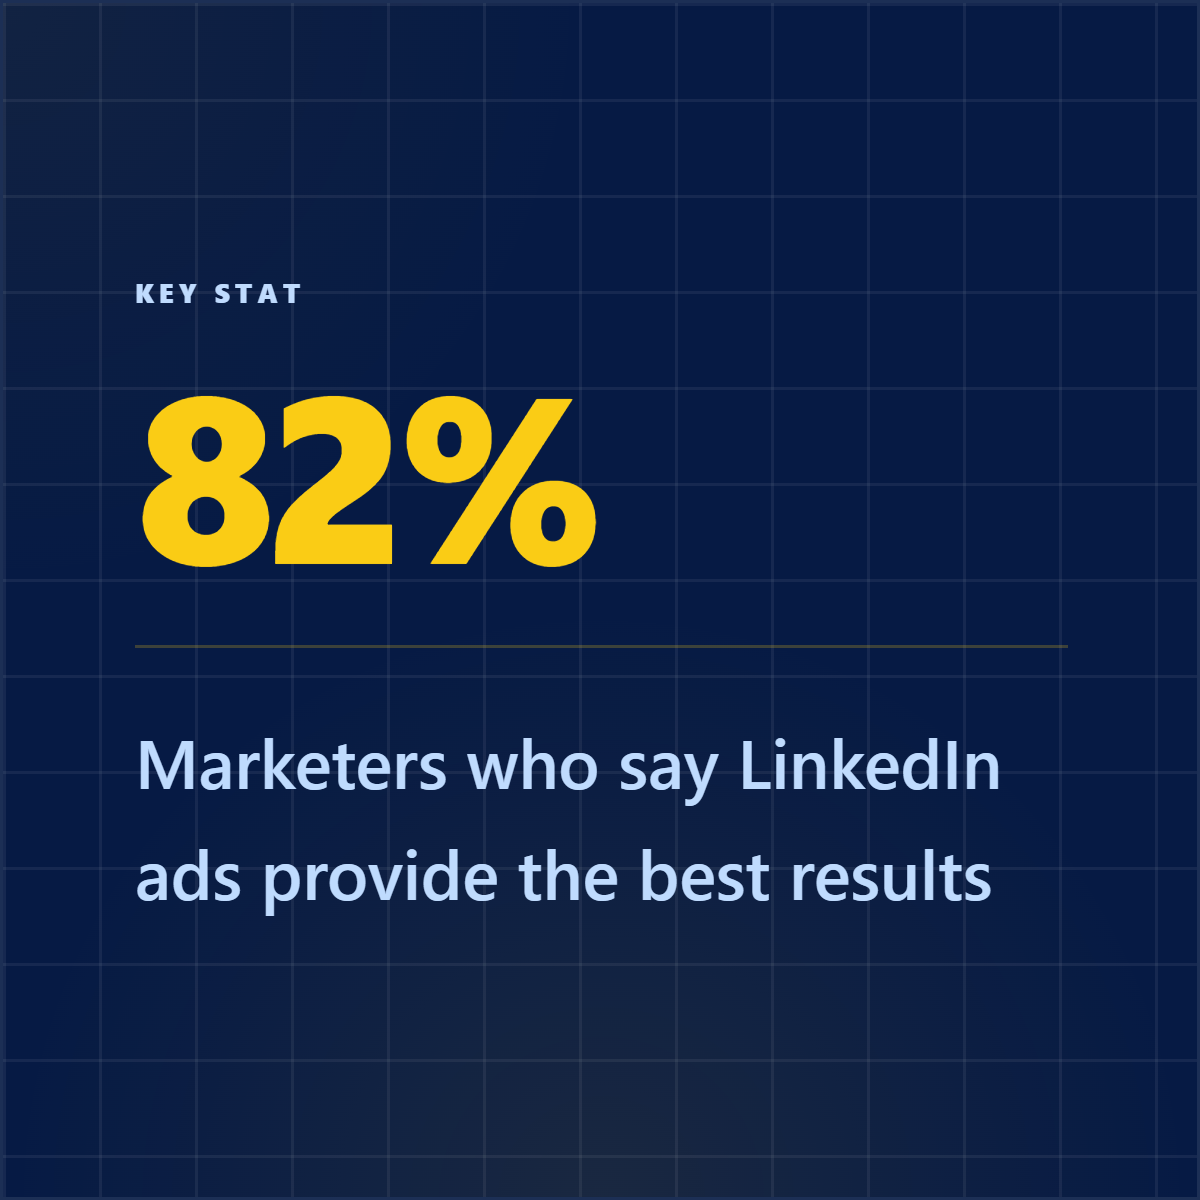
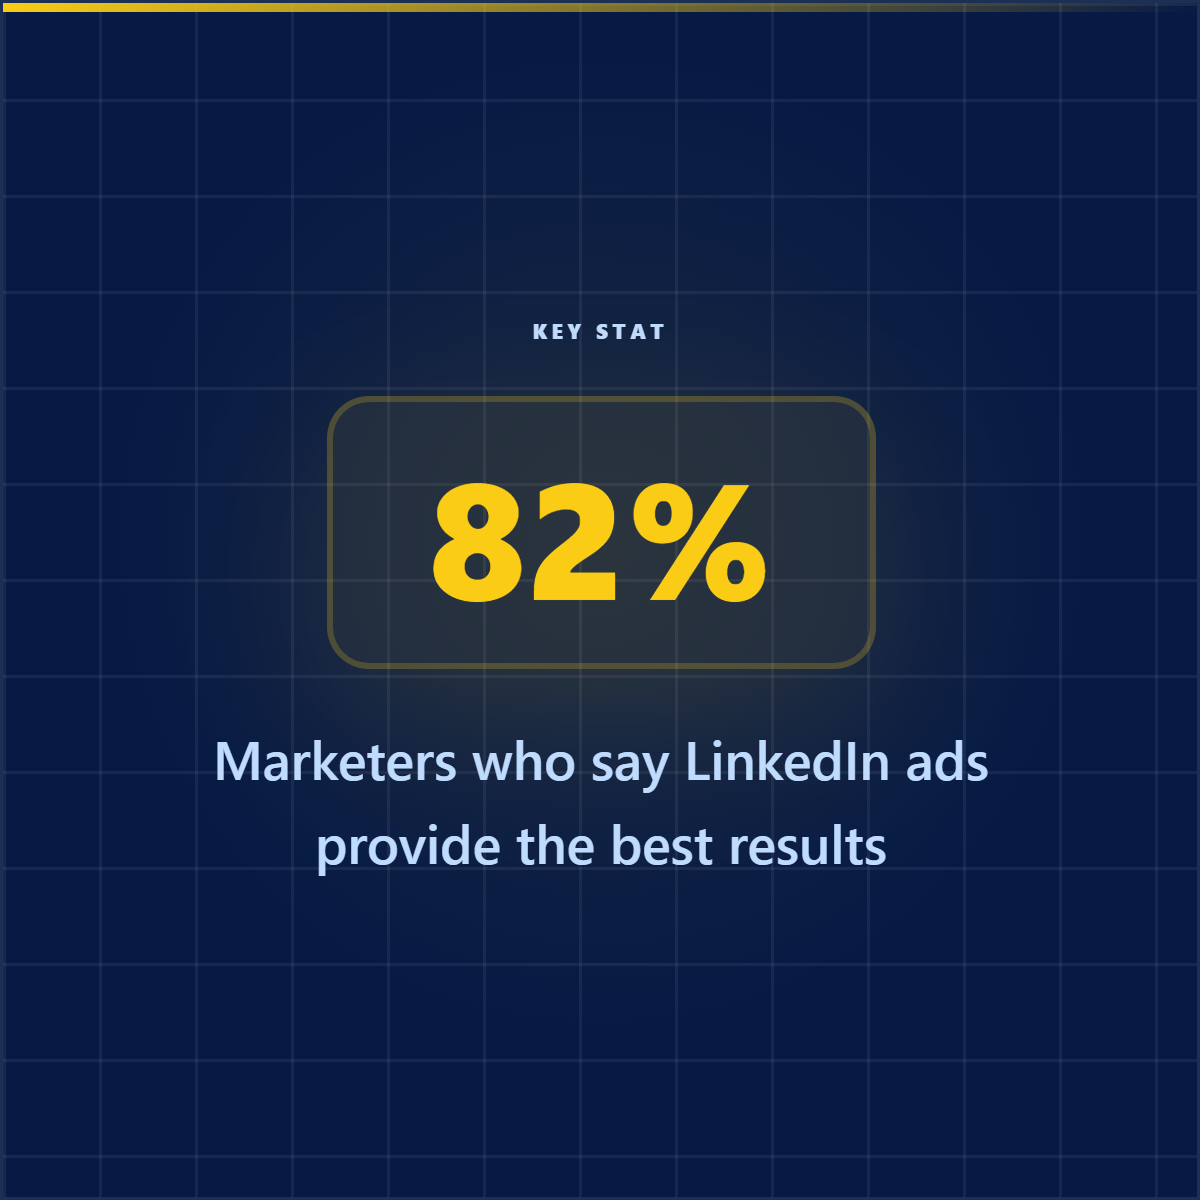
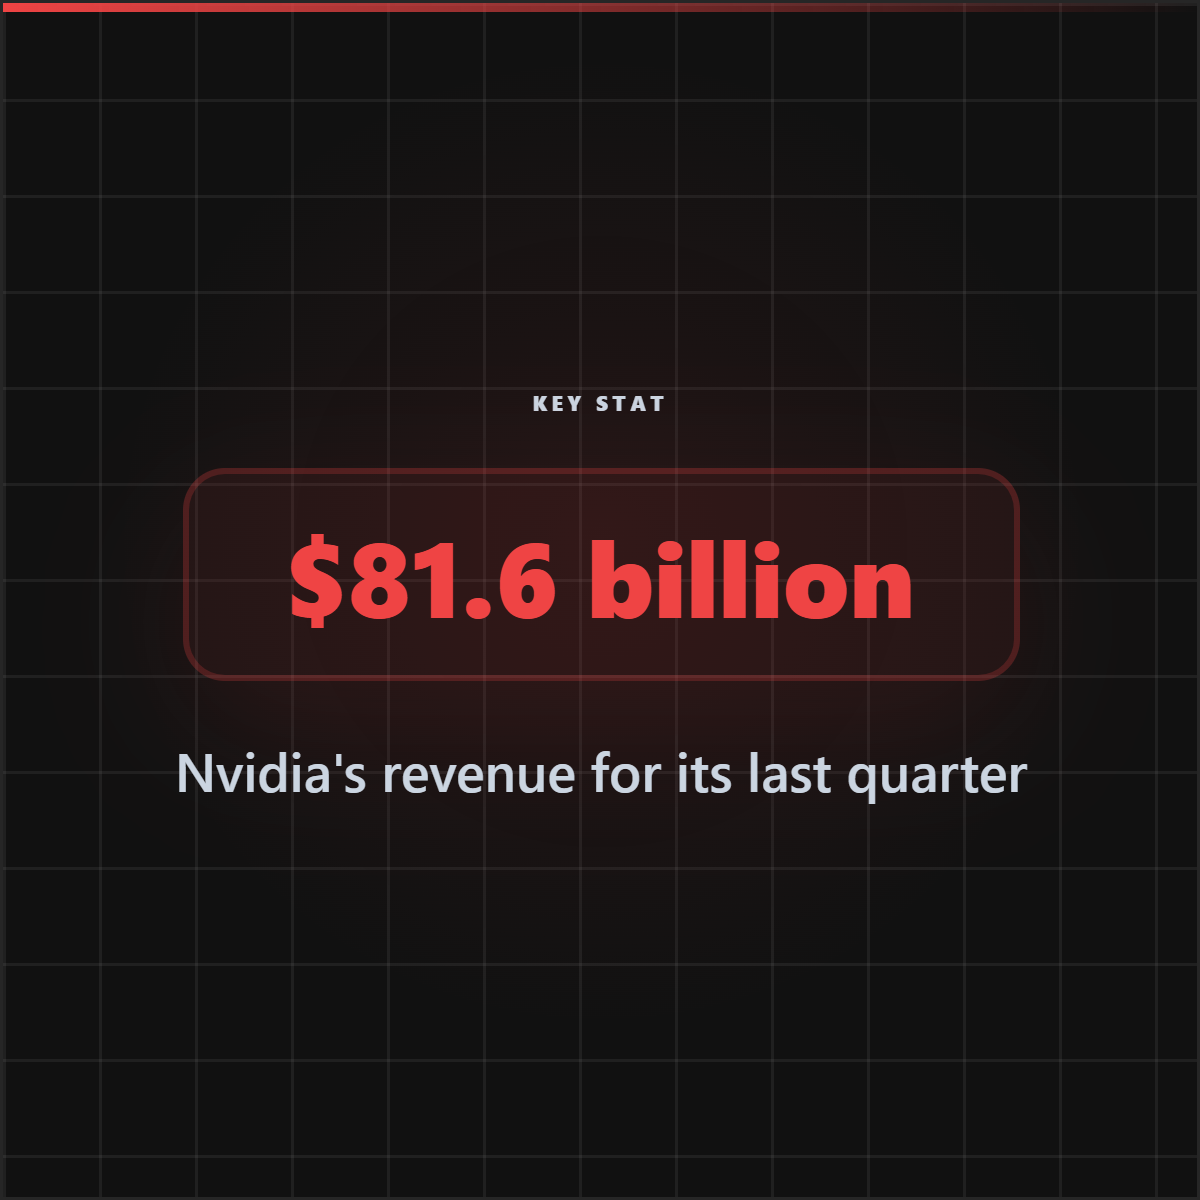
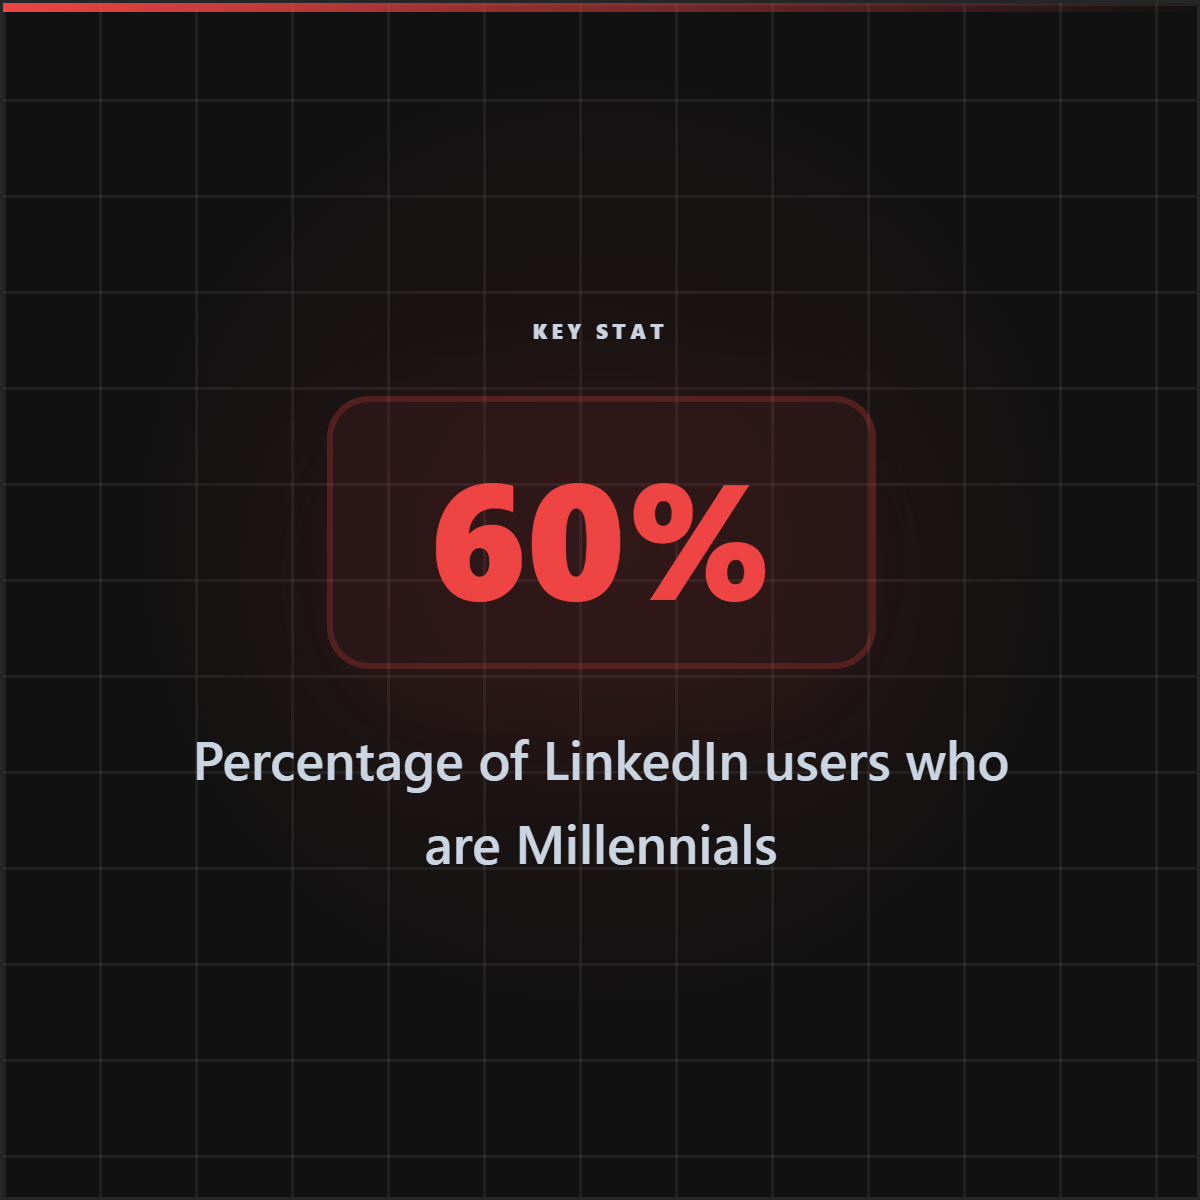
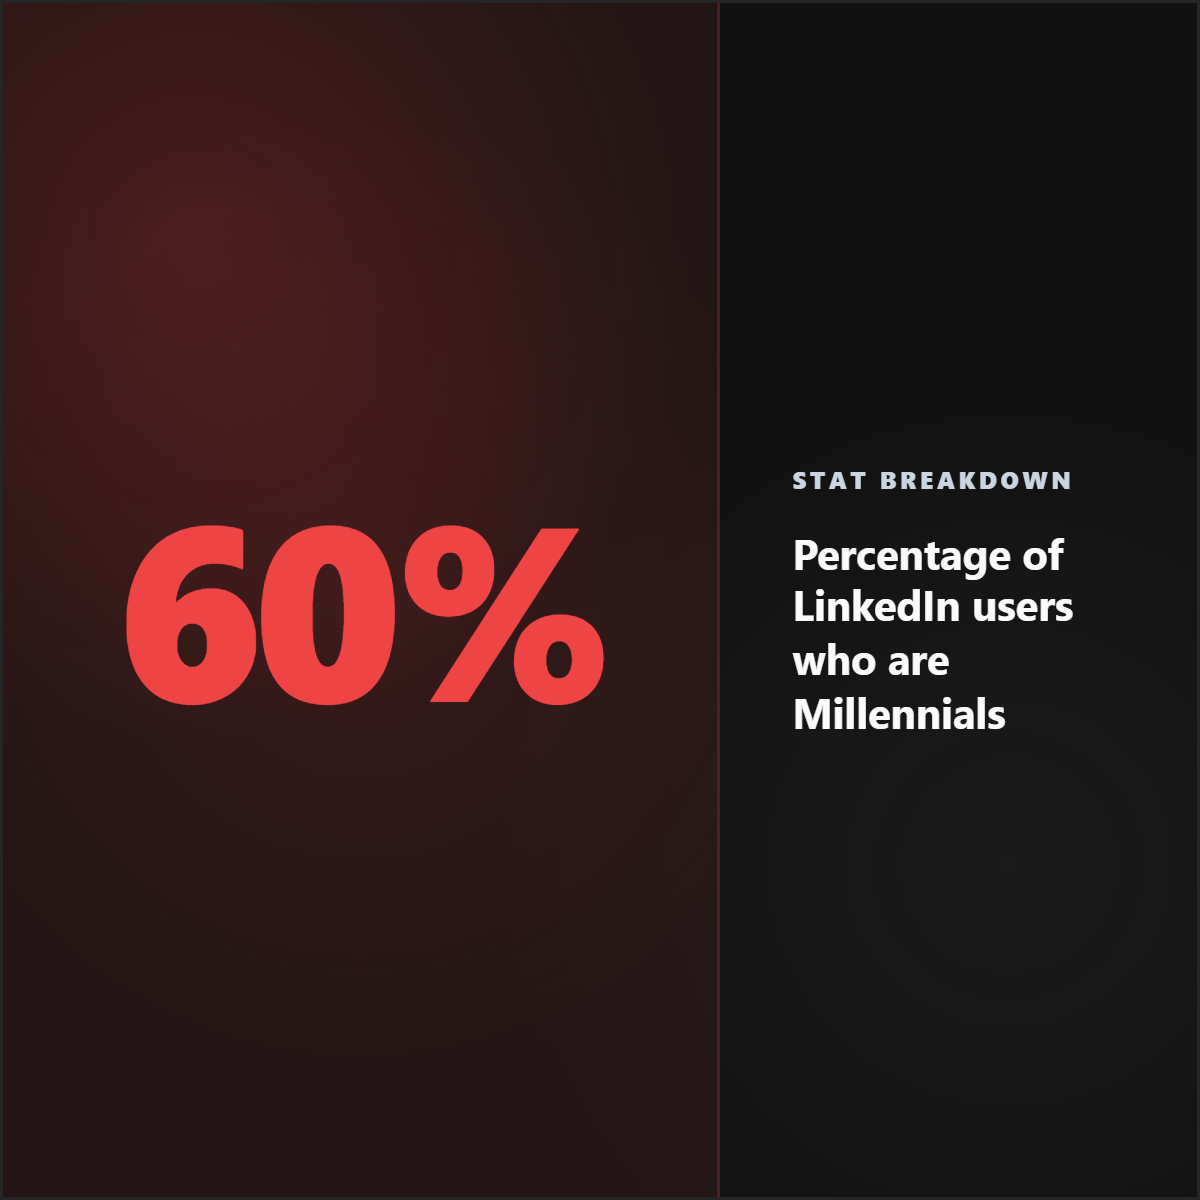
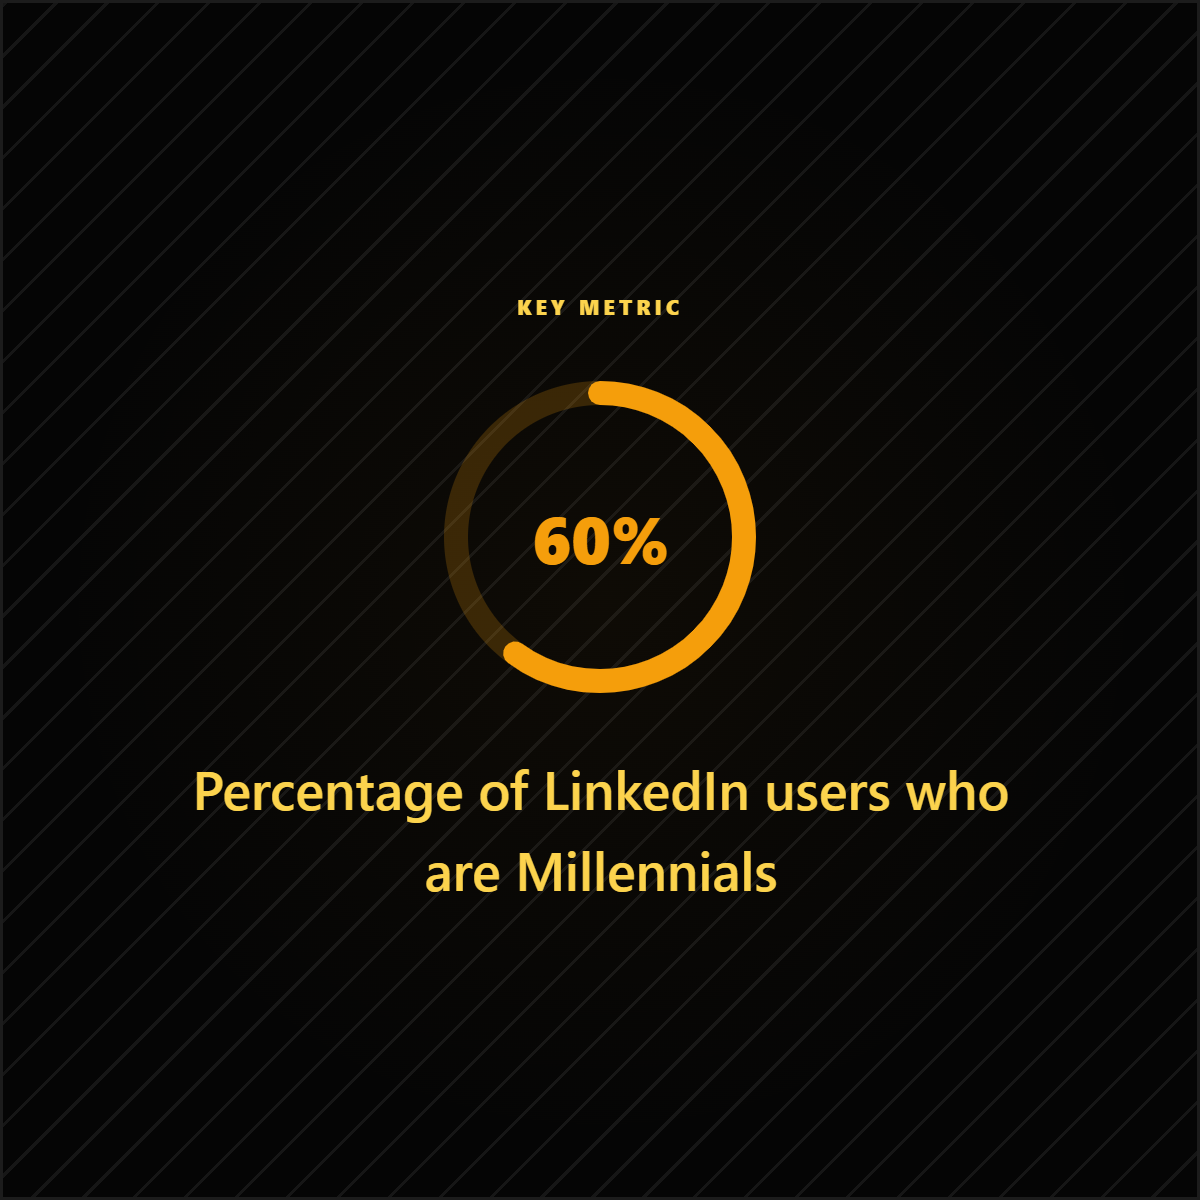
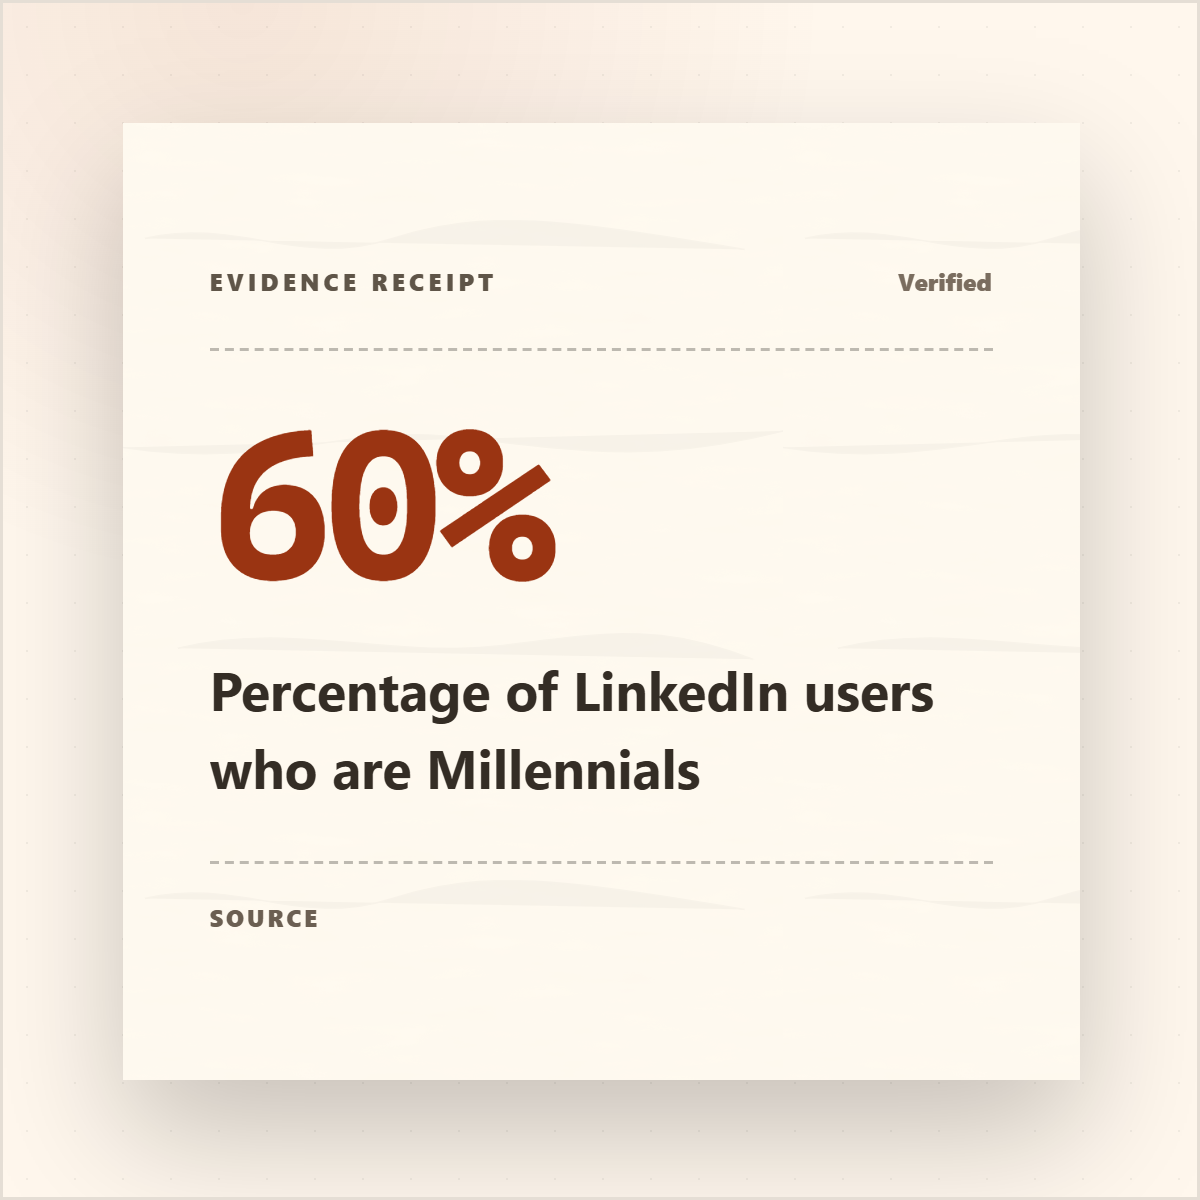
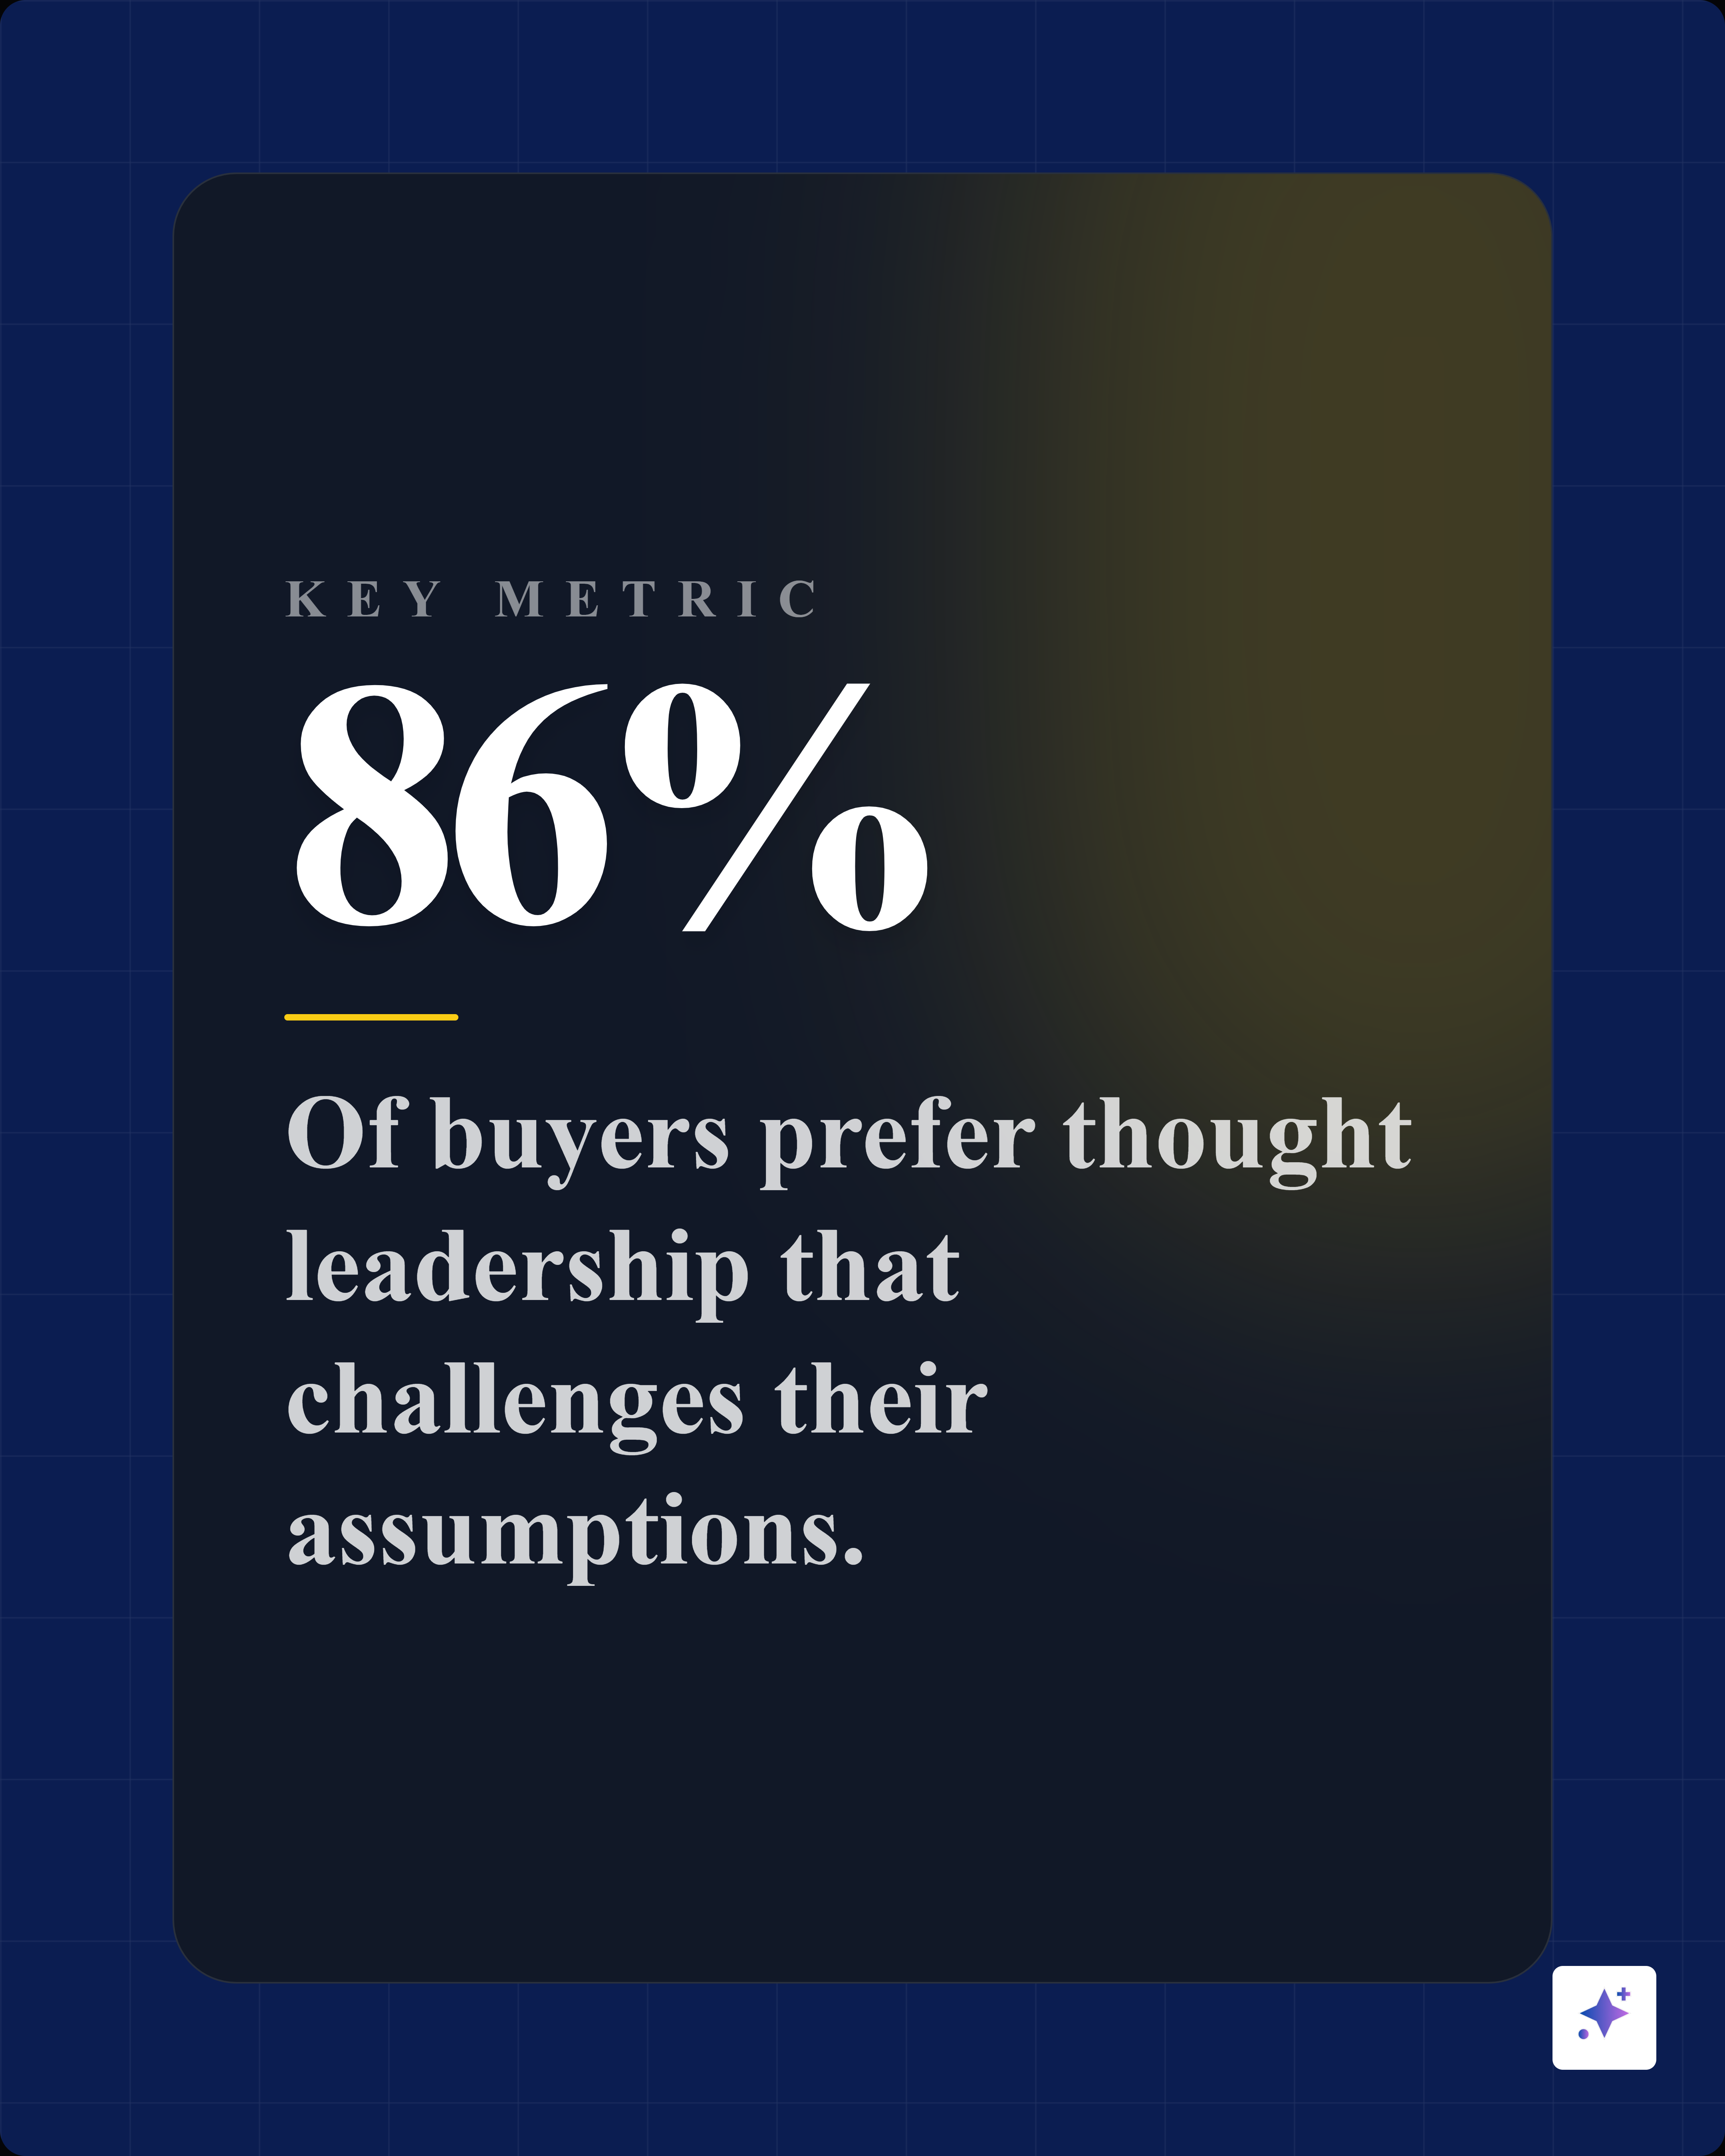
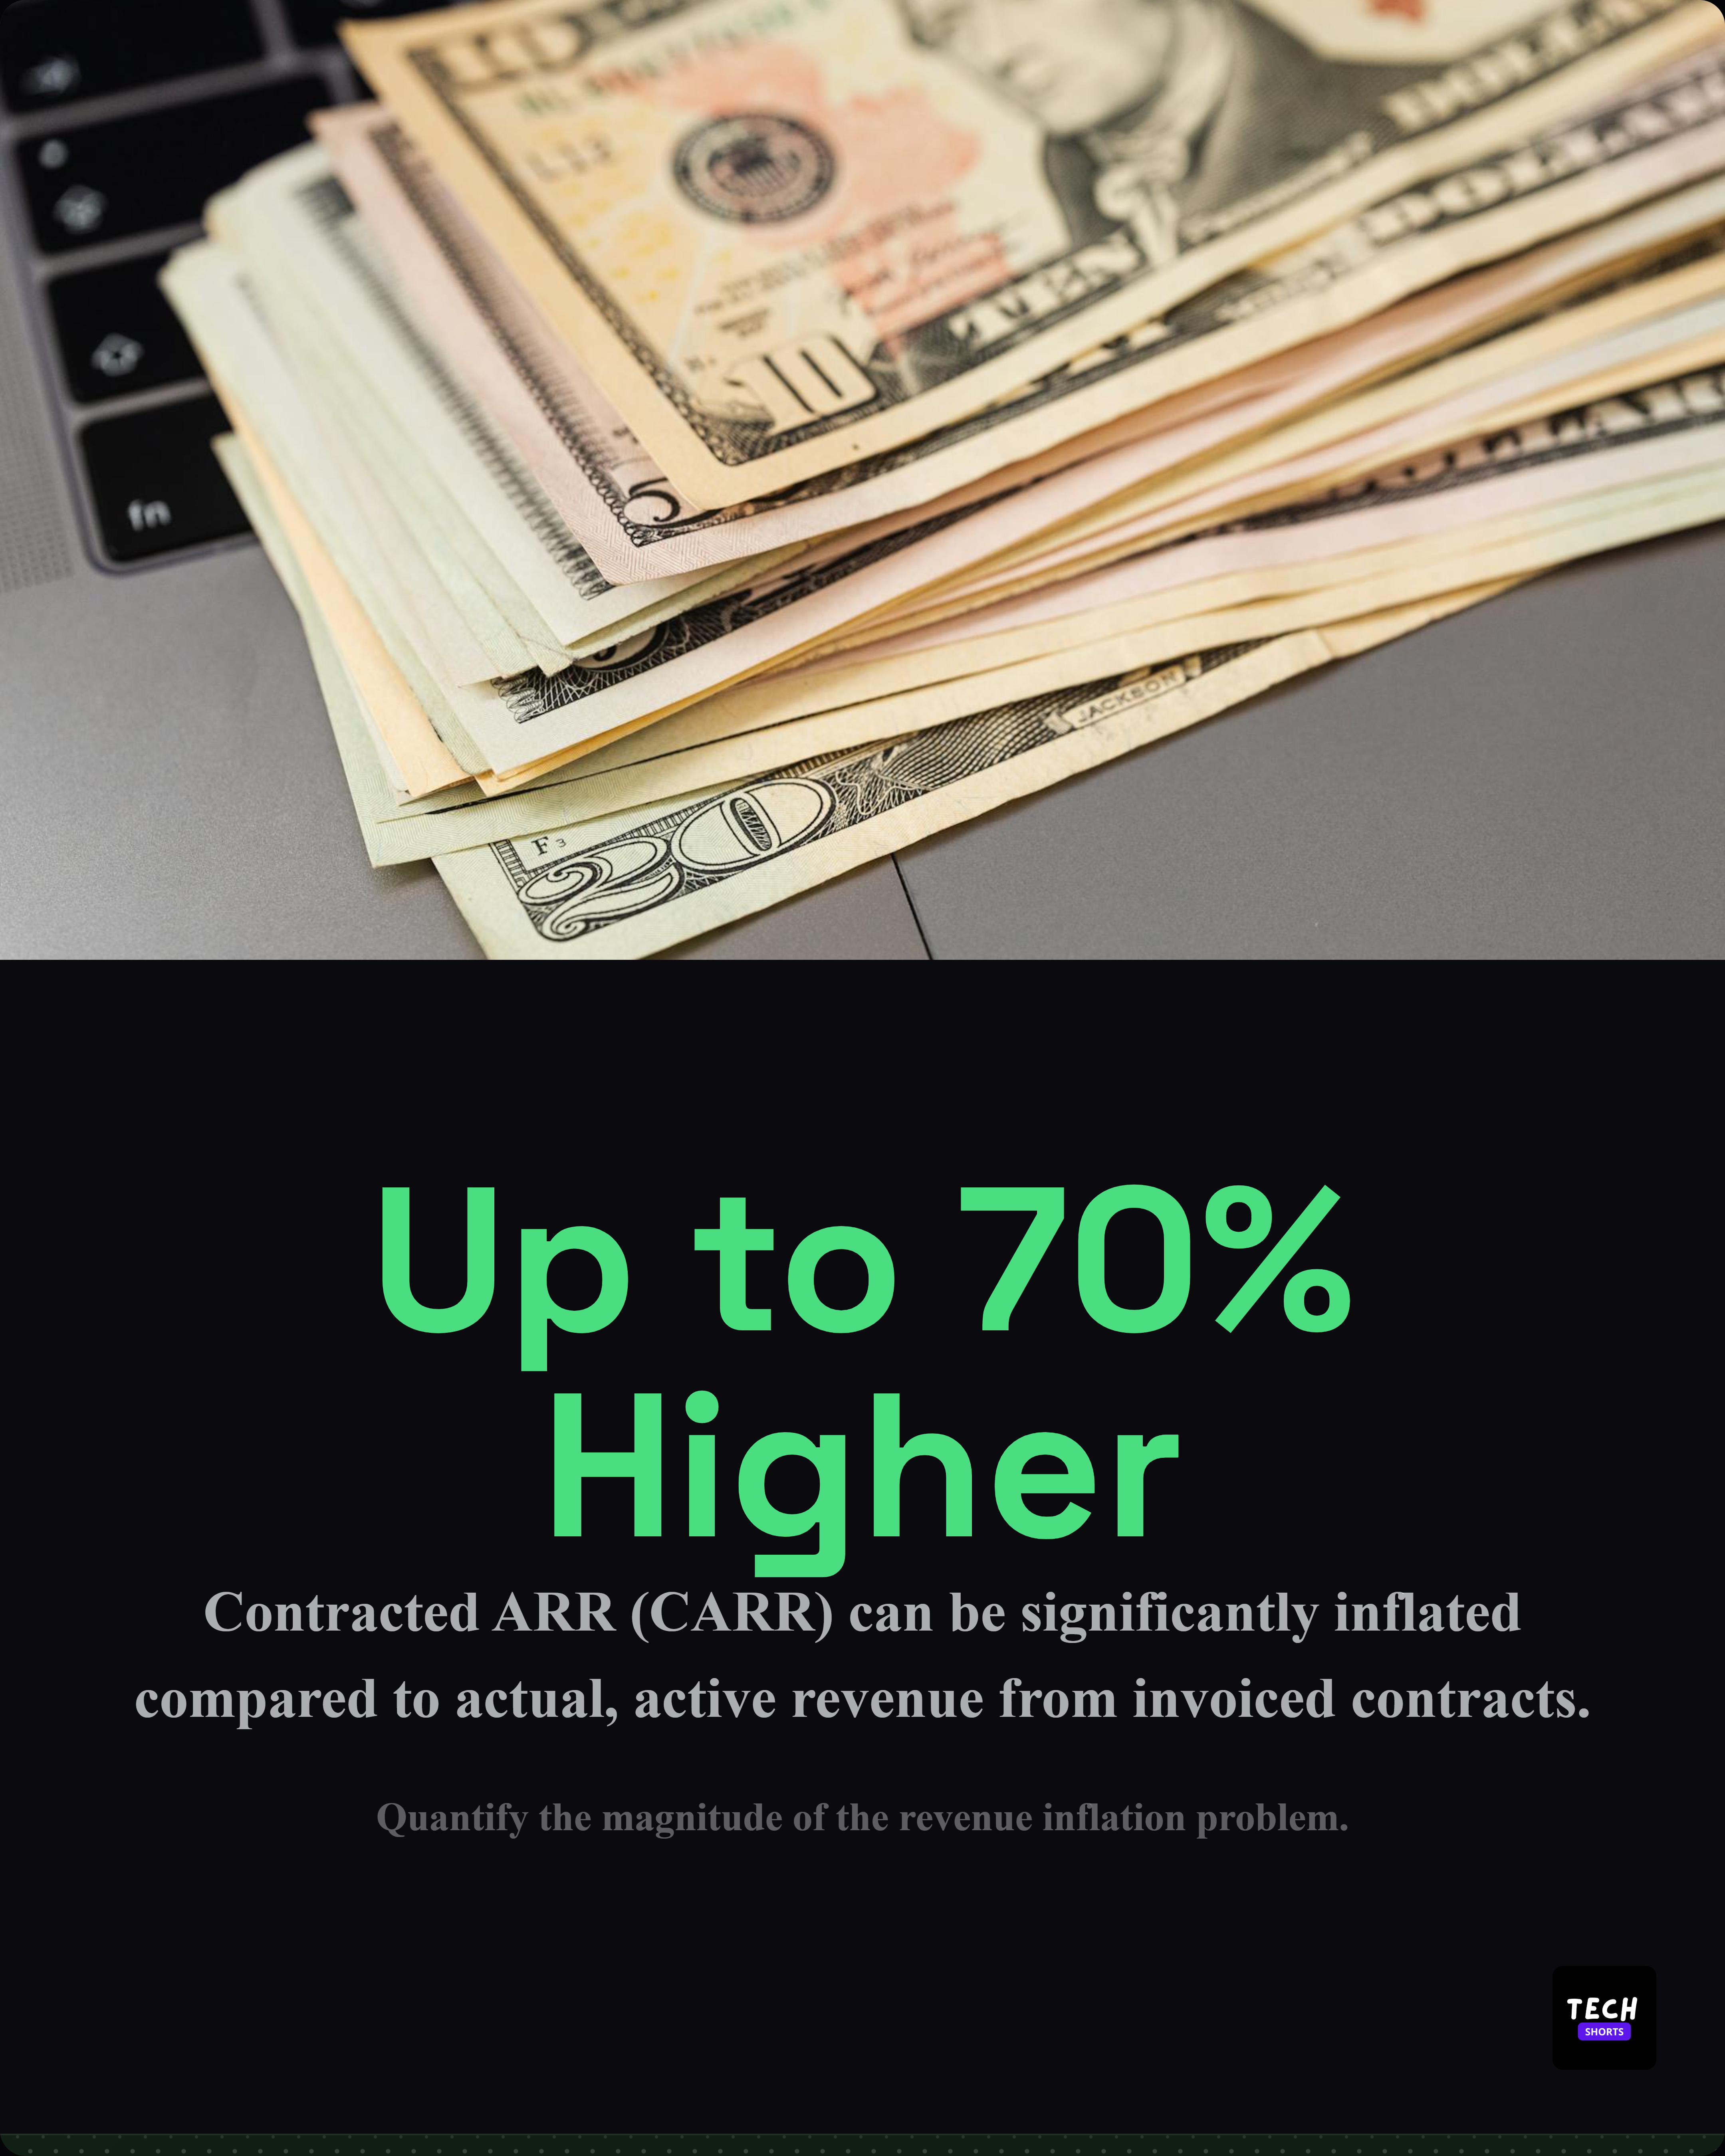
Big Number
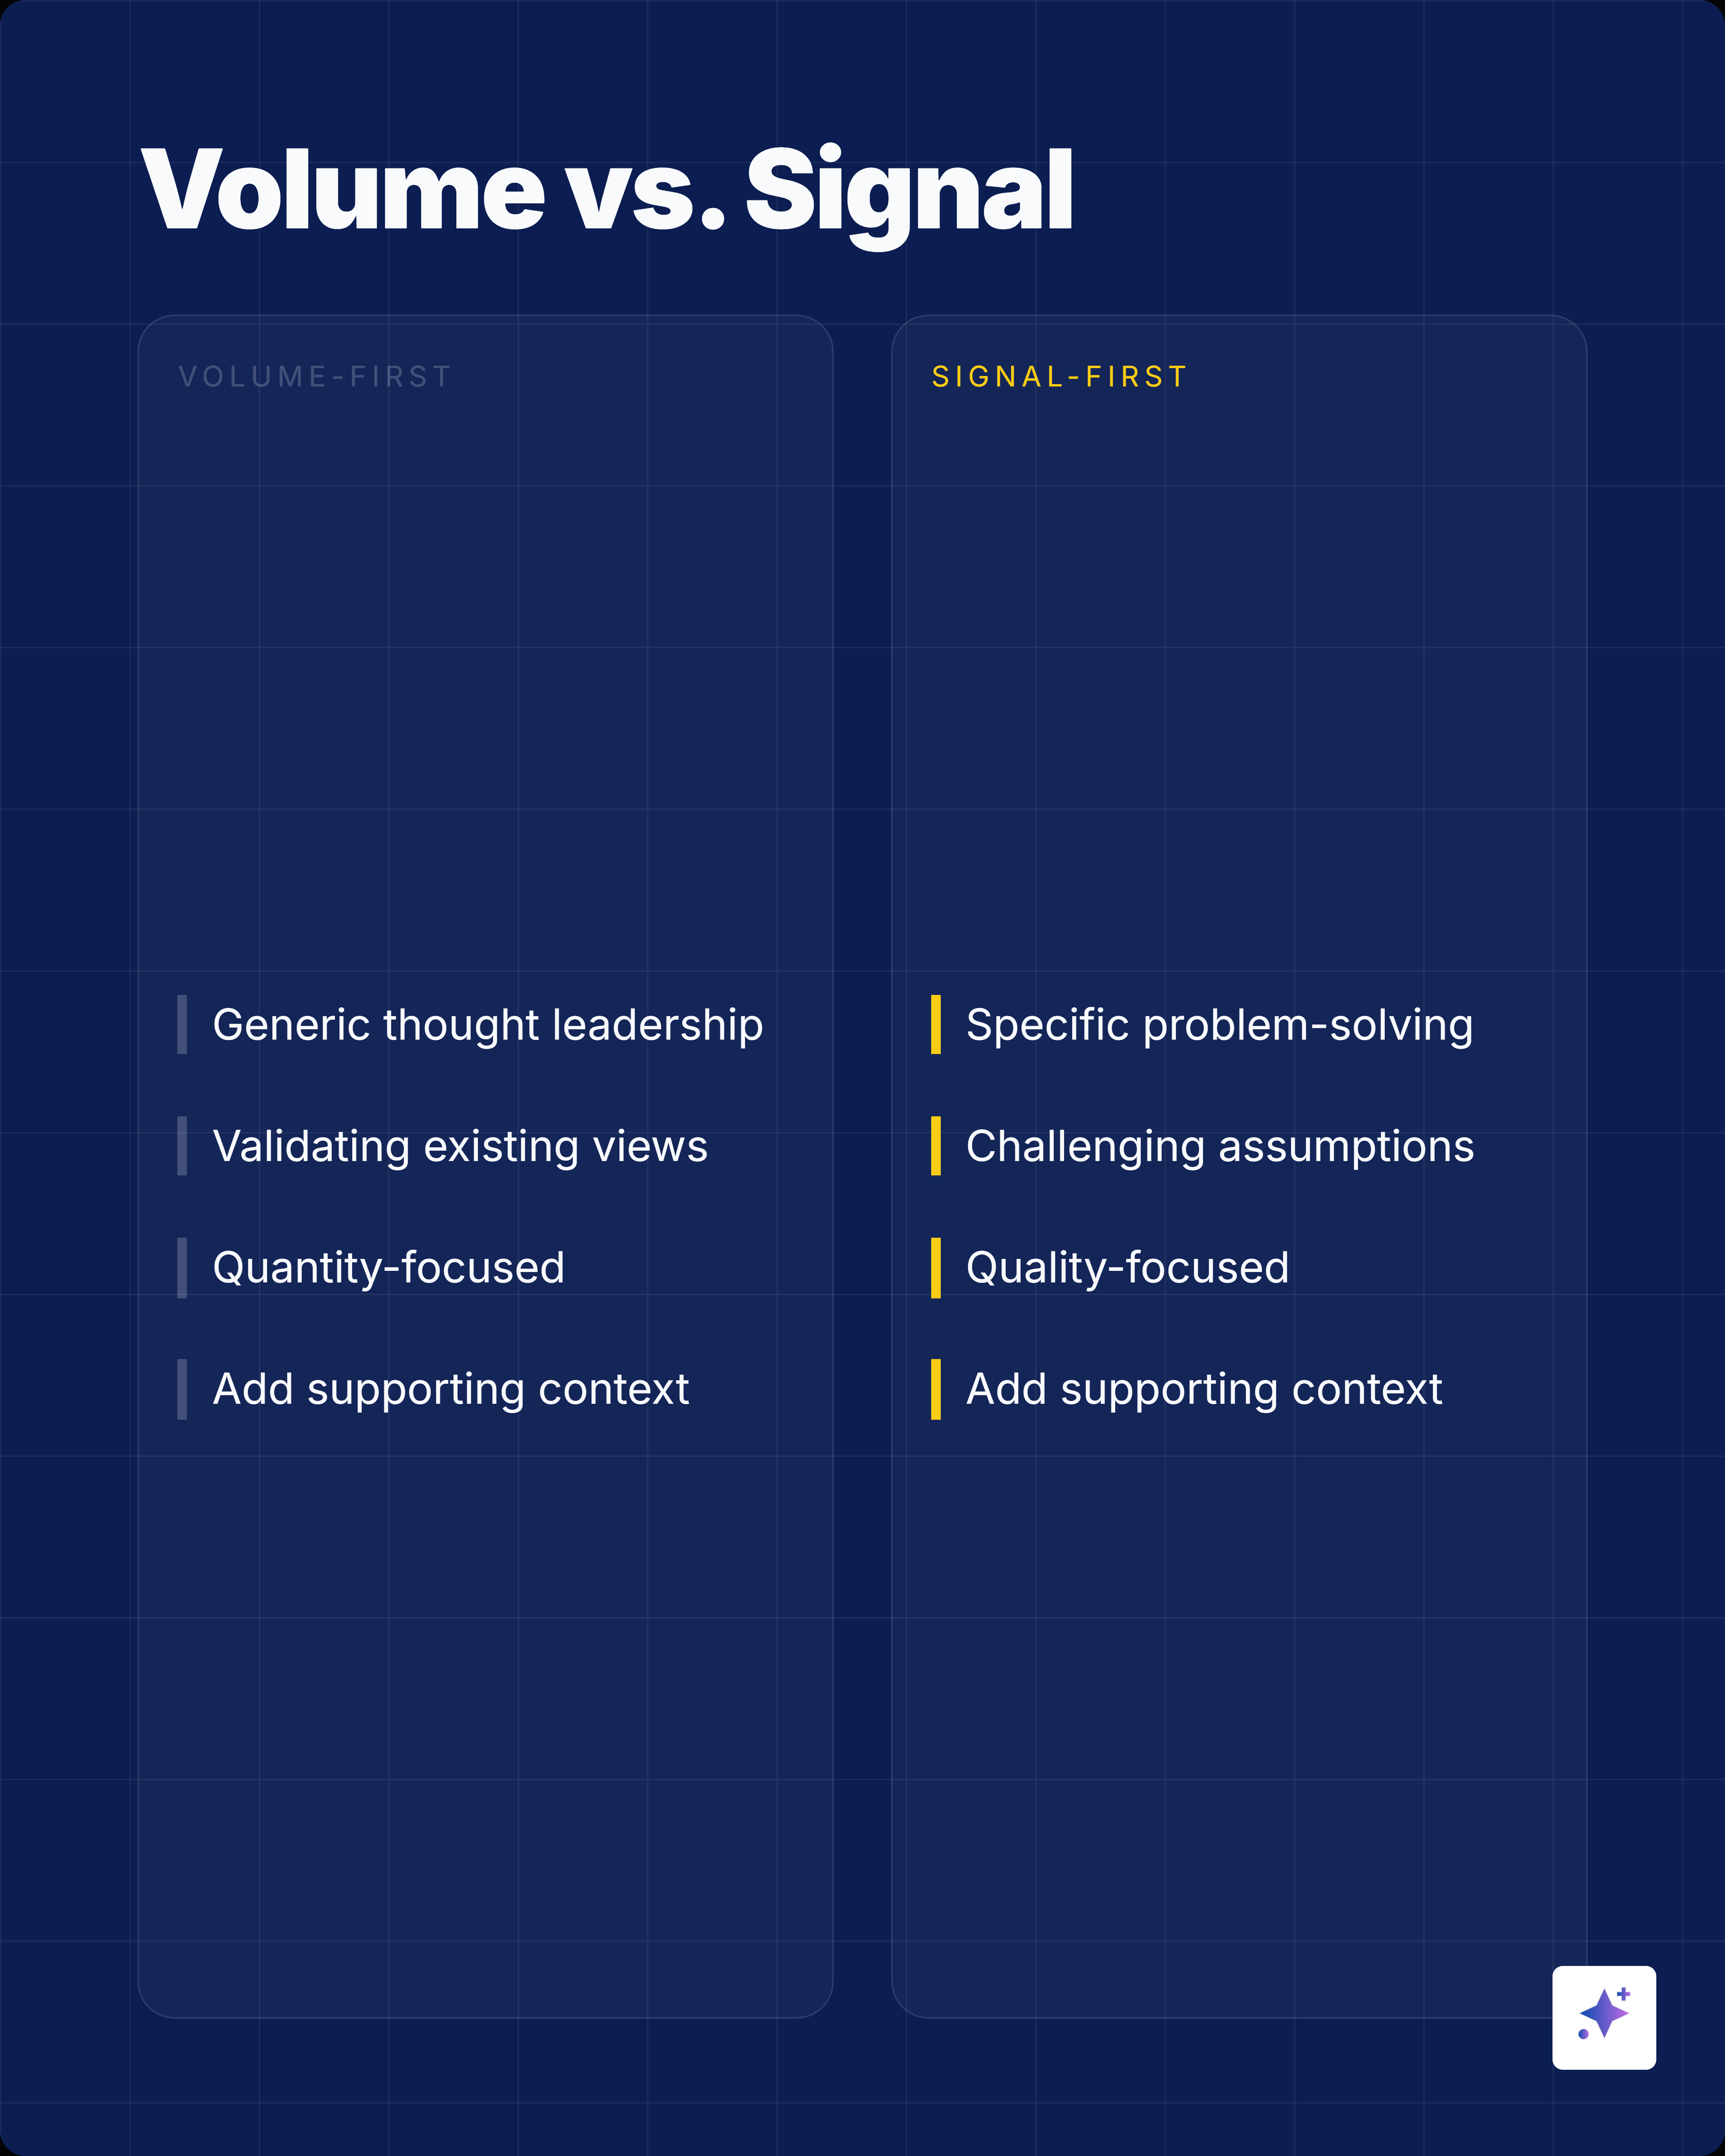
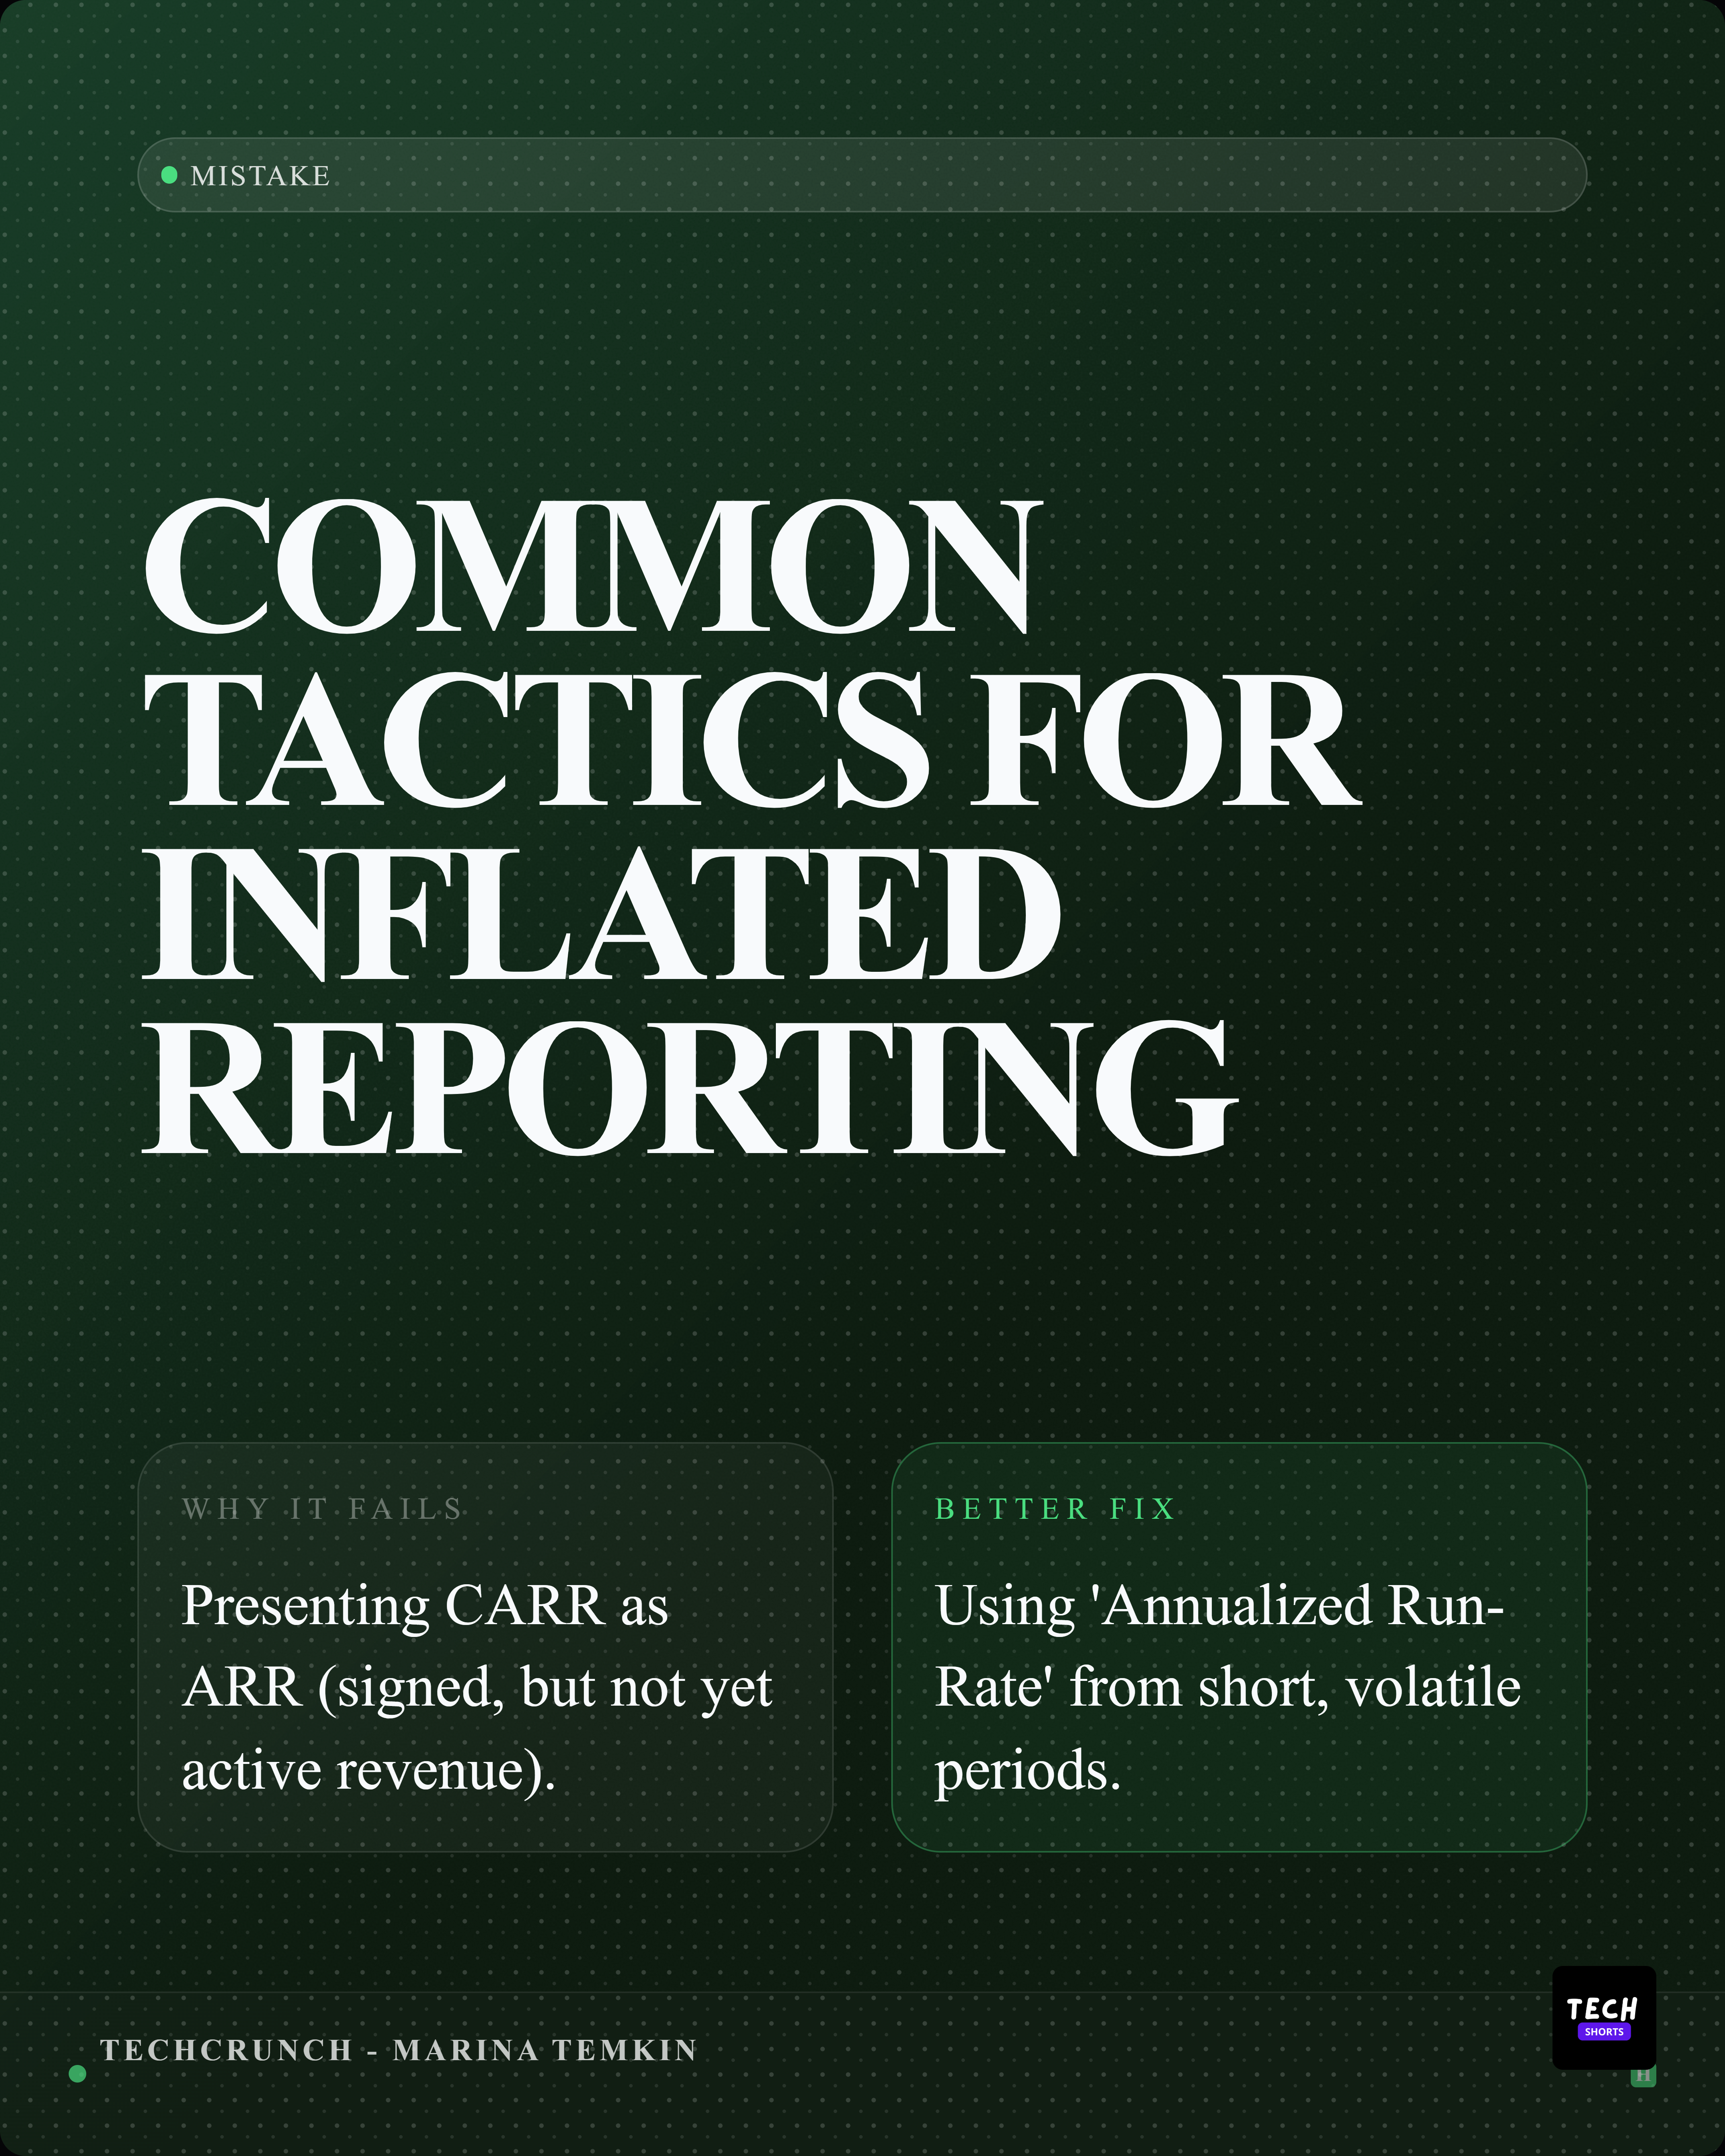
Comparison
% Ring
Receipt
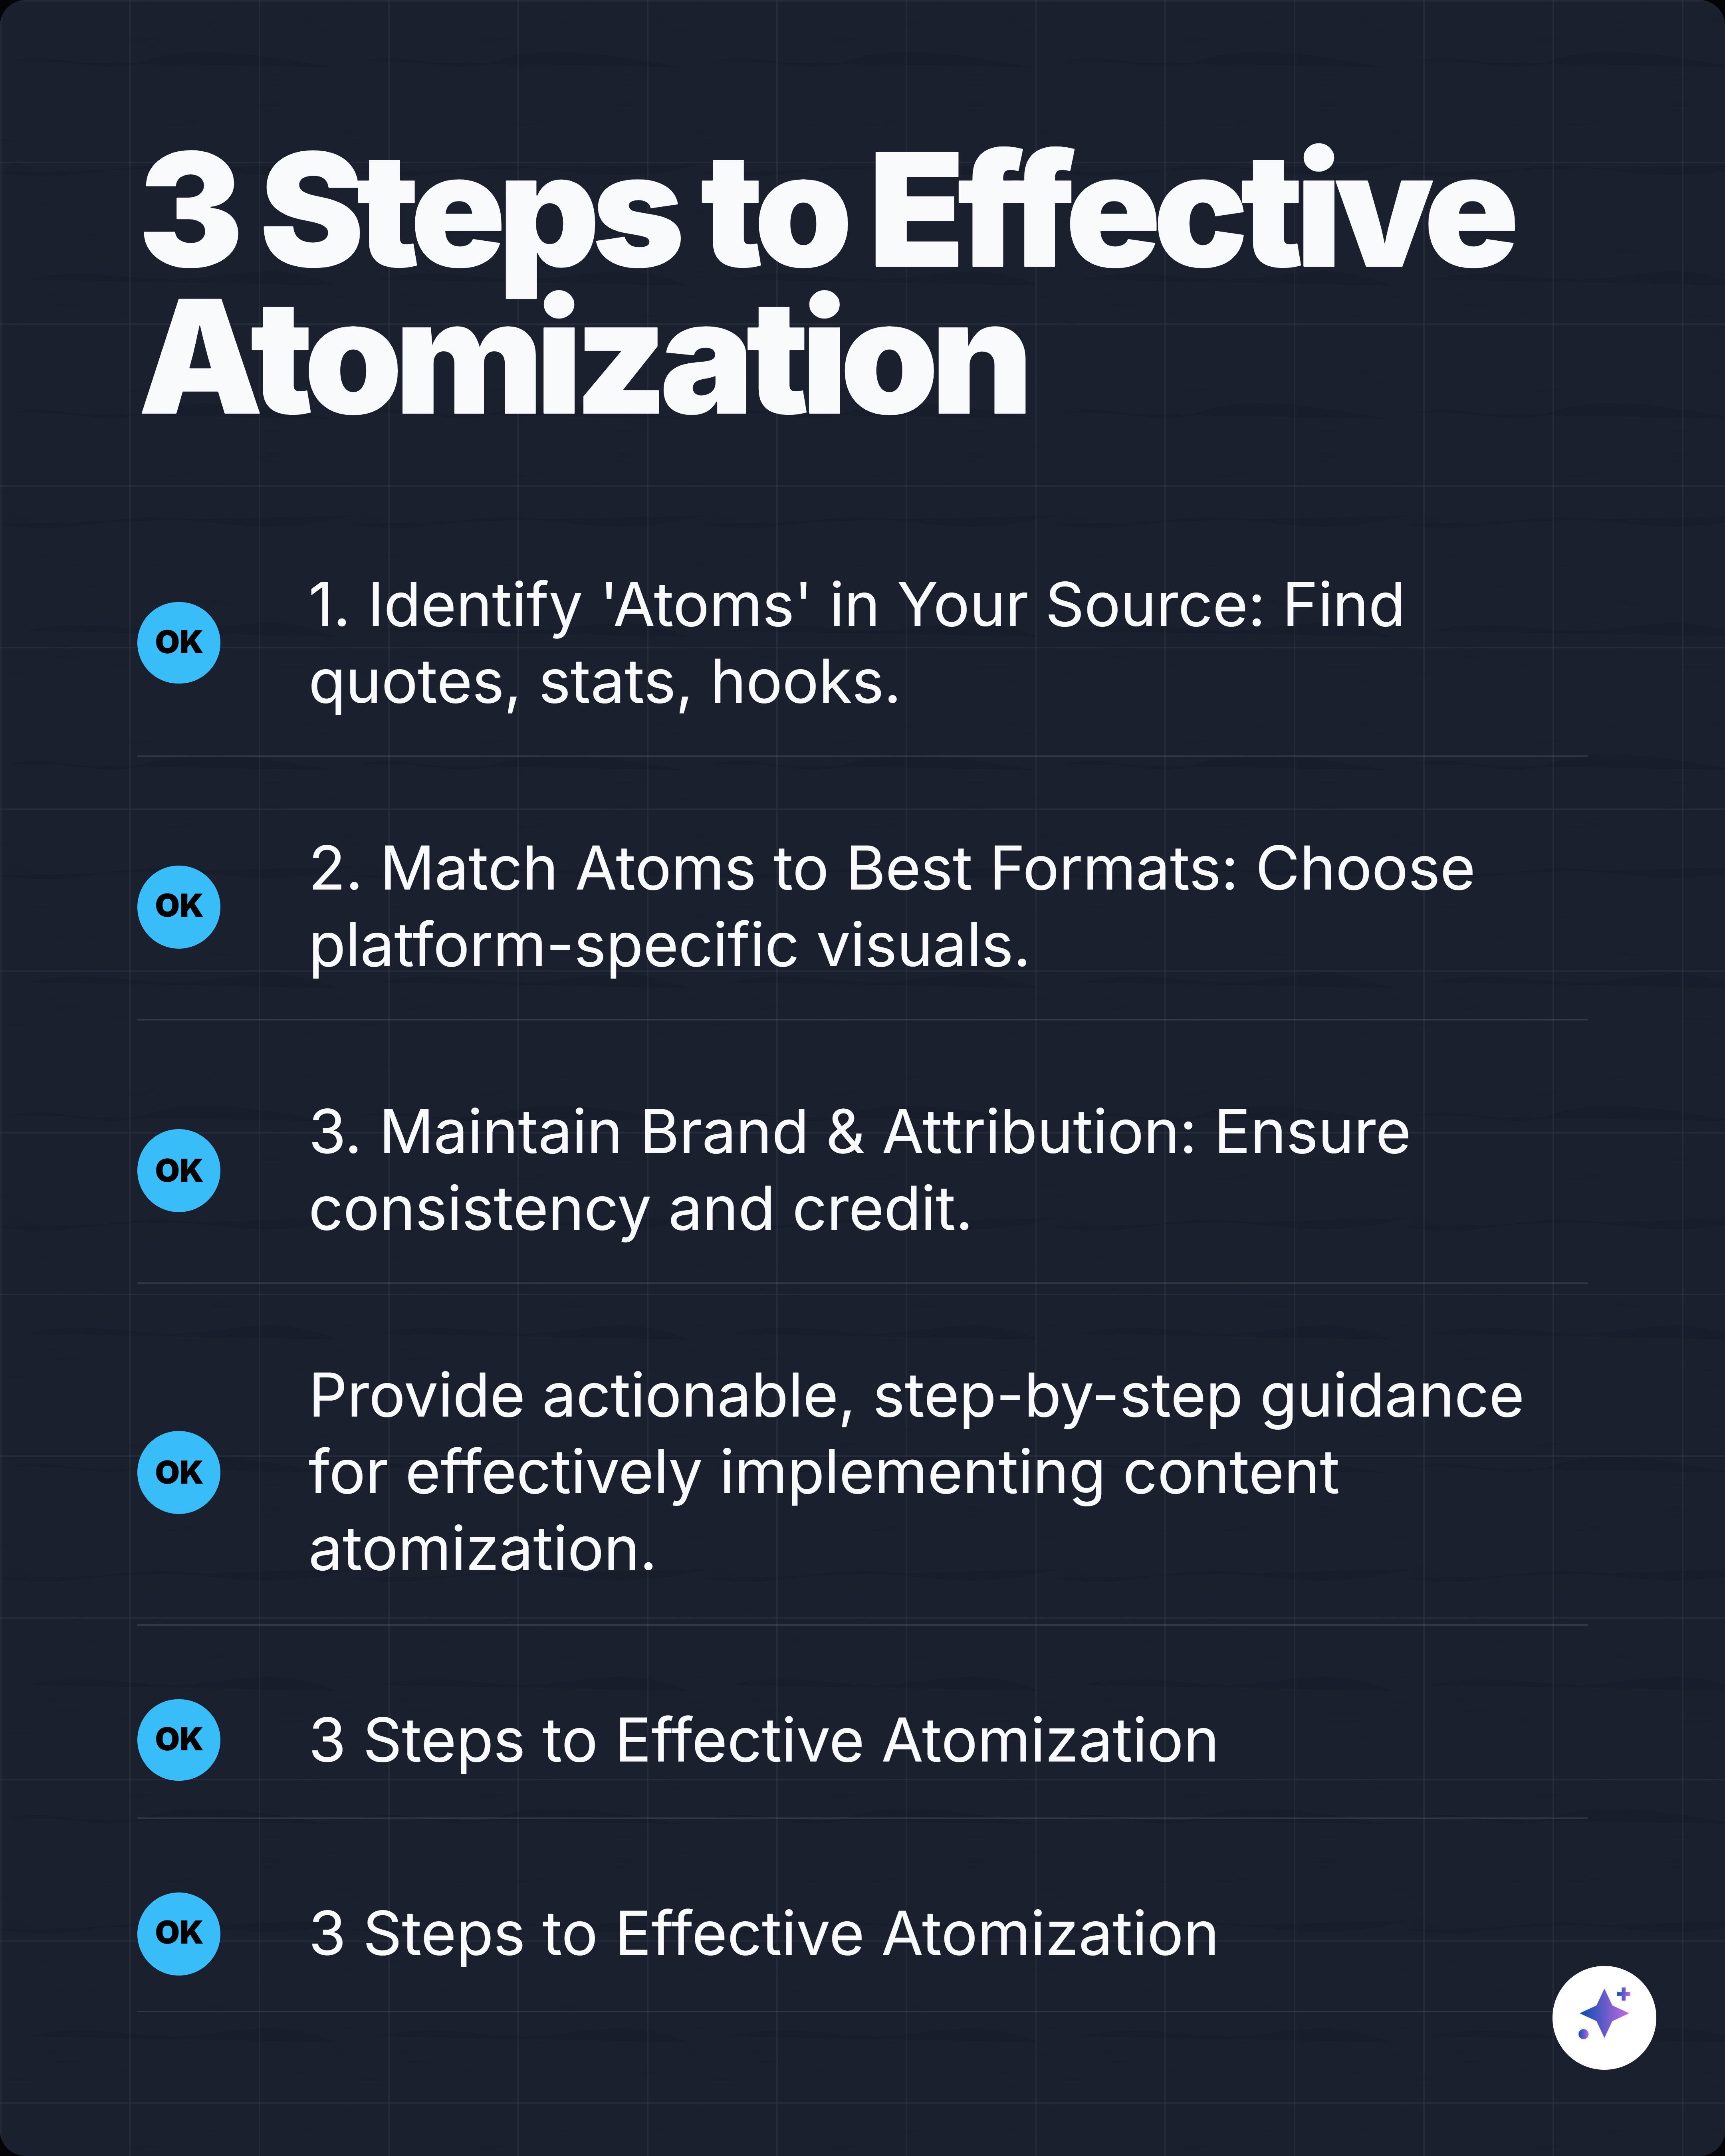
How it works
Three steps. Zero design skills.
Paste a URL with data
Reports, articles, research papers, case studies — any public URL with text content.
AI finds every statistic
Numbers, percentages, dollar figures, comparisons — extracted automatically from the full text.
Pick a stat, pick a style, download
Branded, attributed, ready to post on LinkedIn, X, Instagram, or anywhere.
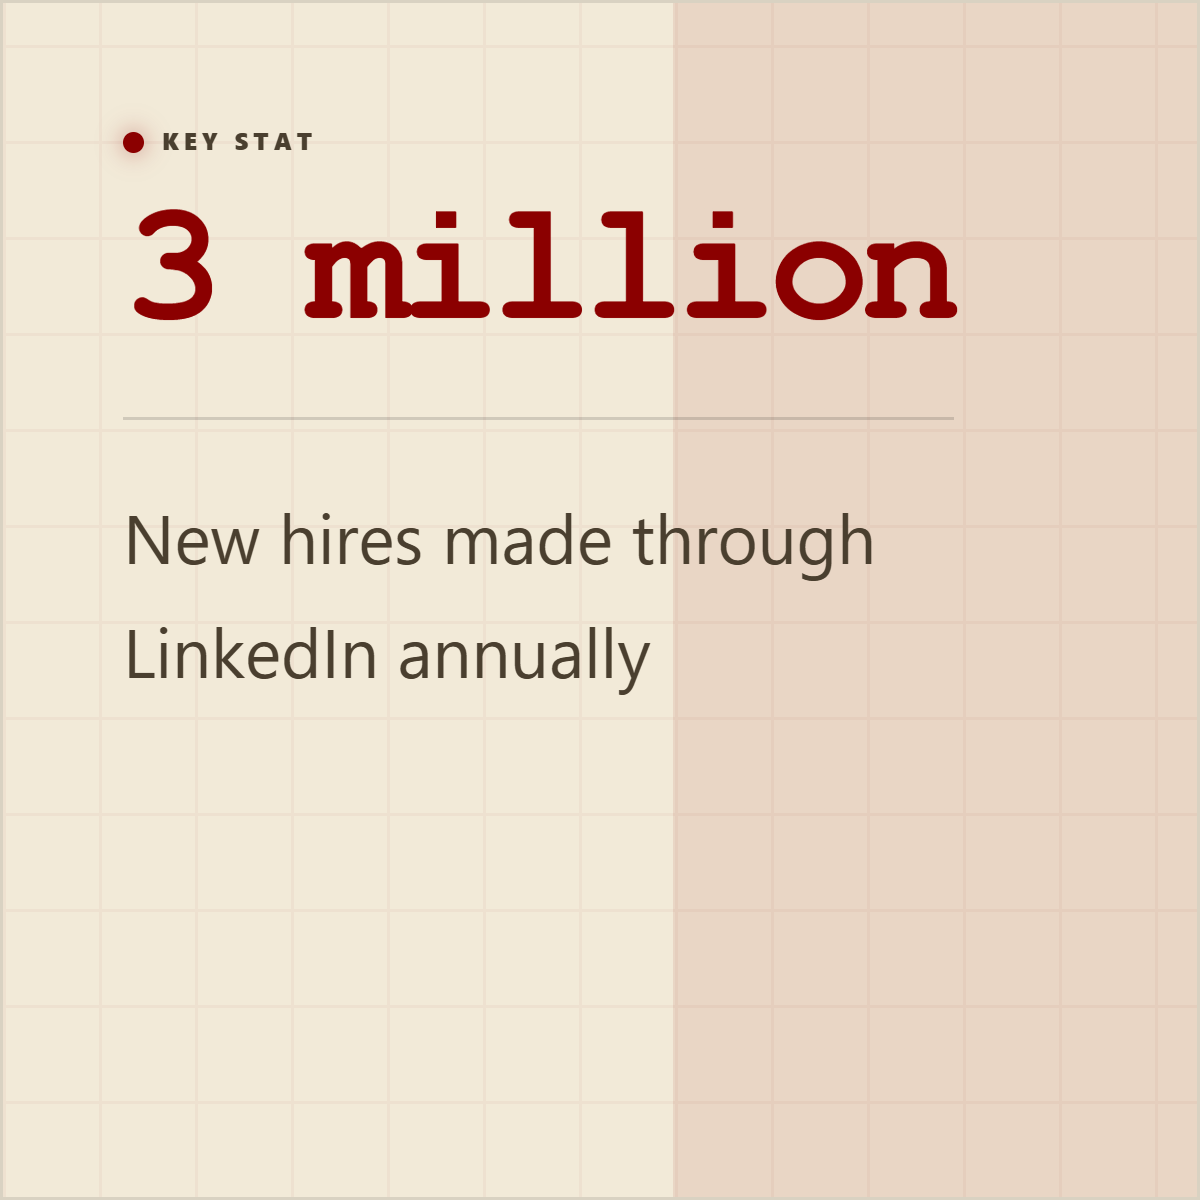
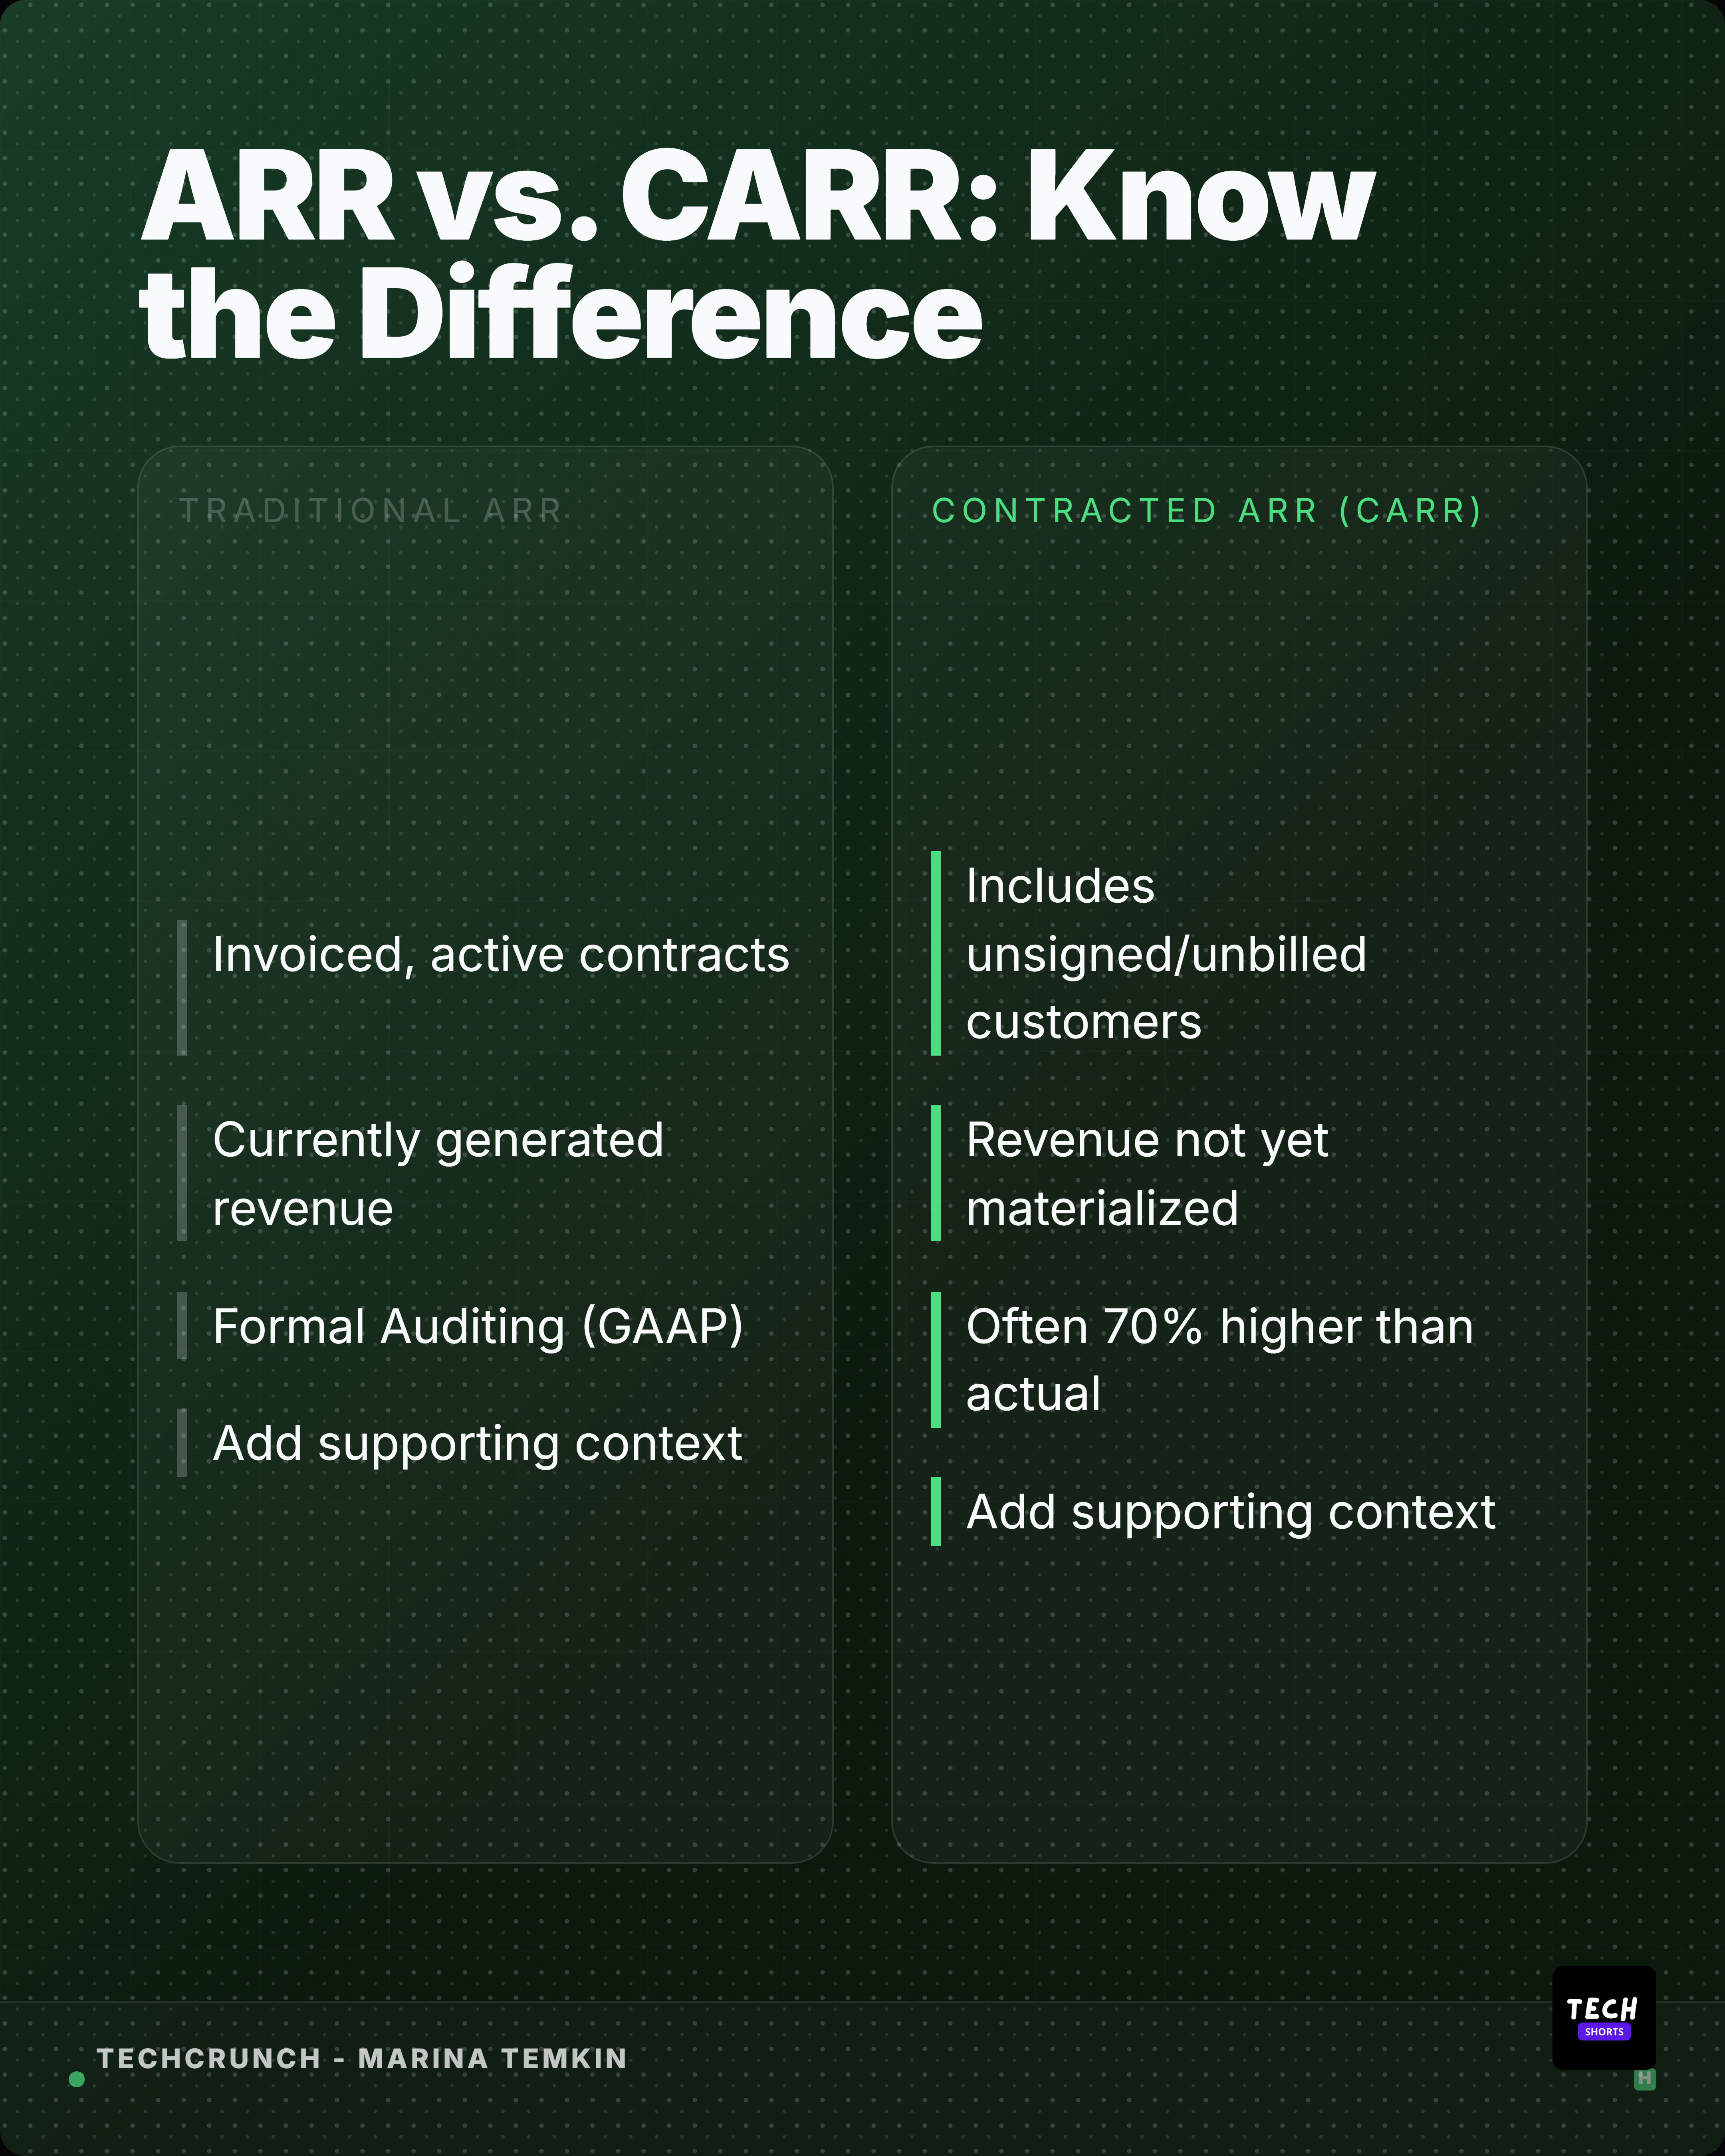
Real extractions
These are real statistics from real reports.
Each card below was generated from an actual article URL using Highlightly AI.
Source attribution visible on every card.
Who uses this?
Built for people who work with data.
Researchers
Make findings shareable on social media. Turn dense data into visual proof points.
Marketers
Turn report data into social proof. Back up claims with sourced, branded graphics.
Founders
Visualize your metrics for investors. Turn pitch deck numbers into shareable moments.
Journalists
Add data graphics to stories. Make statistics visual and citable.
Manual vs Highlightly
Stop copying numbers into Canva.
Extract every statistic from an article — automatically
Highlightly reads any article and pulls out every statistic, data point, and number — then turns them into branded stat cards with source attribution.