How do I create stat cards from a report?
To create stat cards from a report, find one statistic that supports a clear takeaway, keep the surrounding context, cite the source, and design the number so it is instantly readable. A good stat card is not just a big number. It explains what the number means and where it came from.
The useful workflow is extraction first, packaging second: find the strongest source-backed material, decide what it proves, then turn it into the format people can actually read in-feed.
The number gets attention. The source context earns the trust.
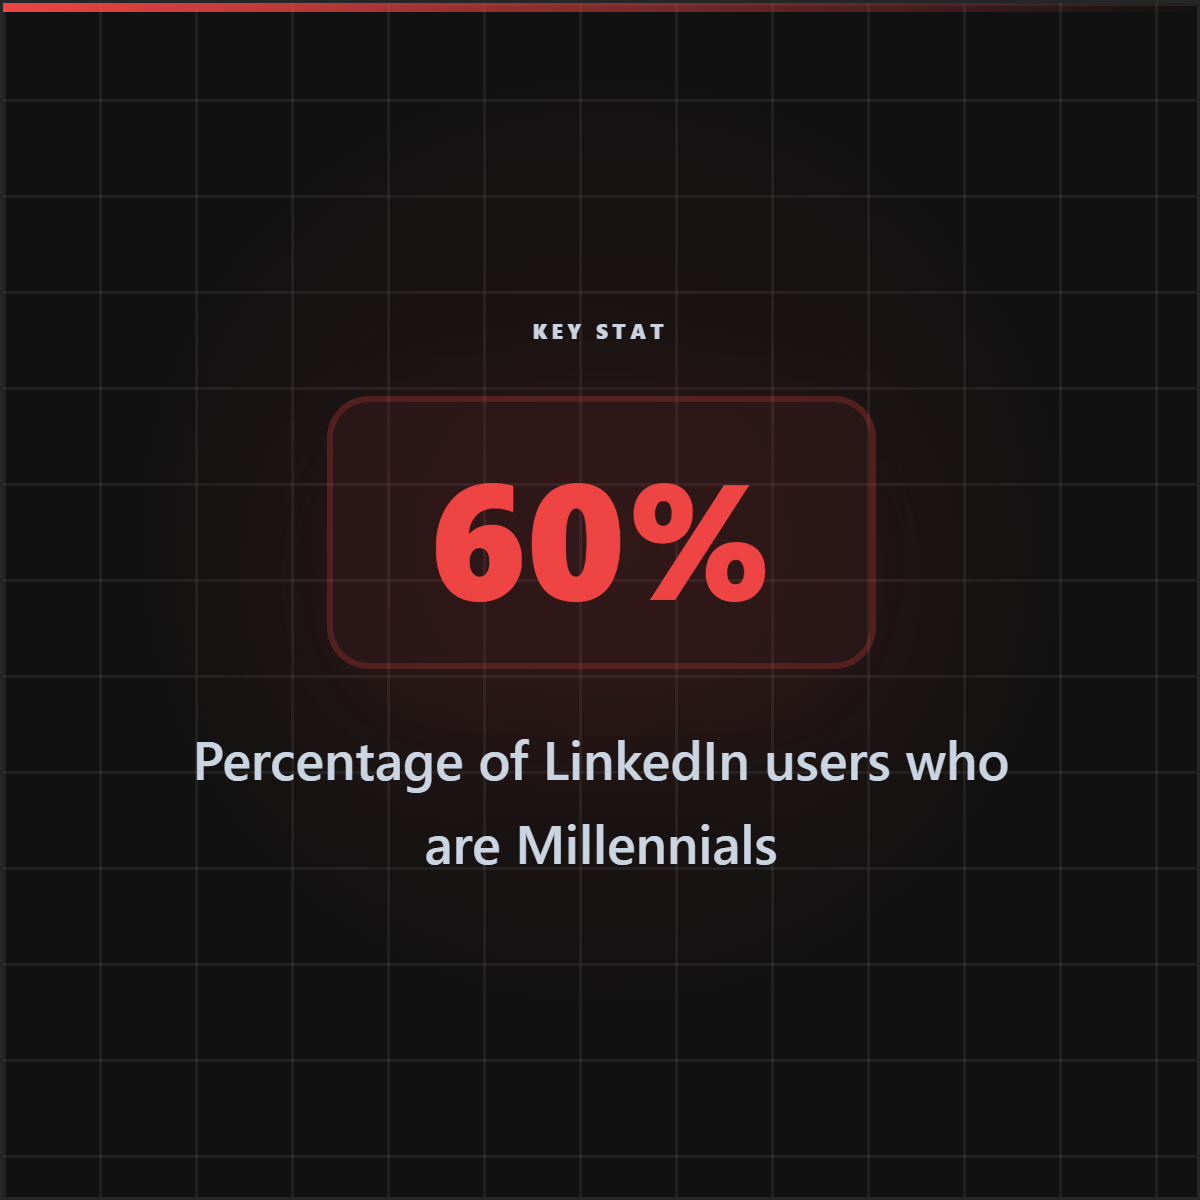
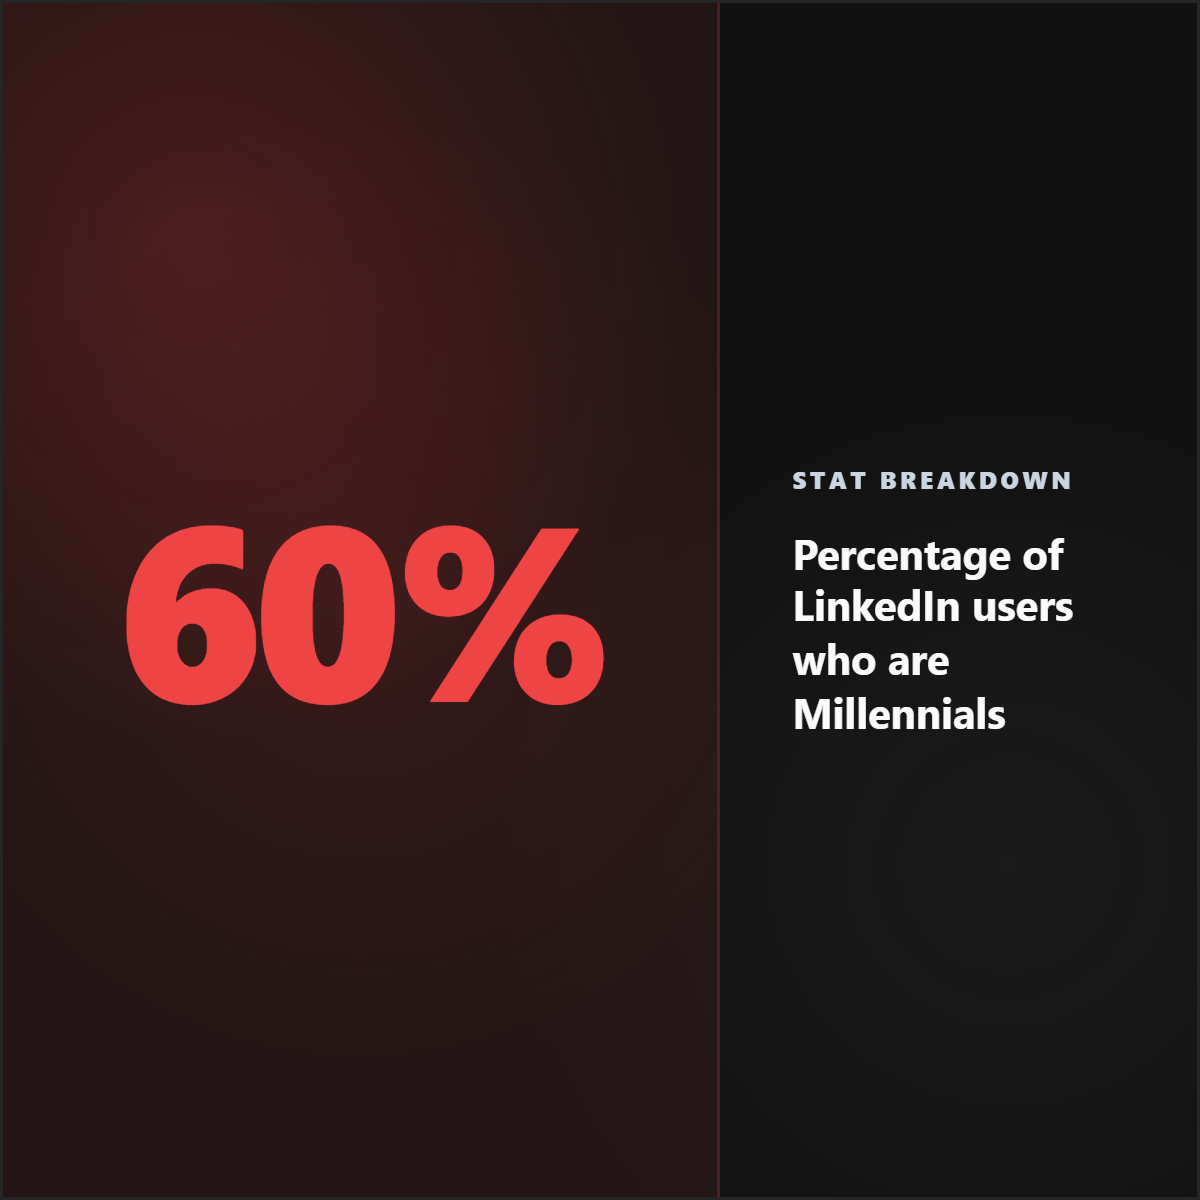
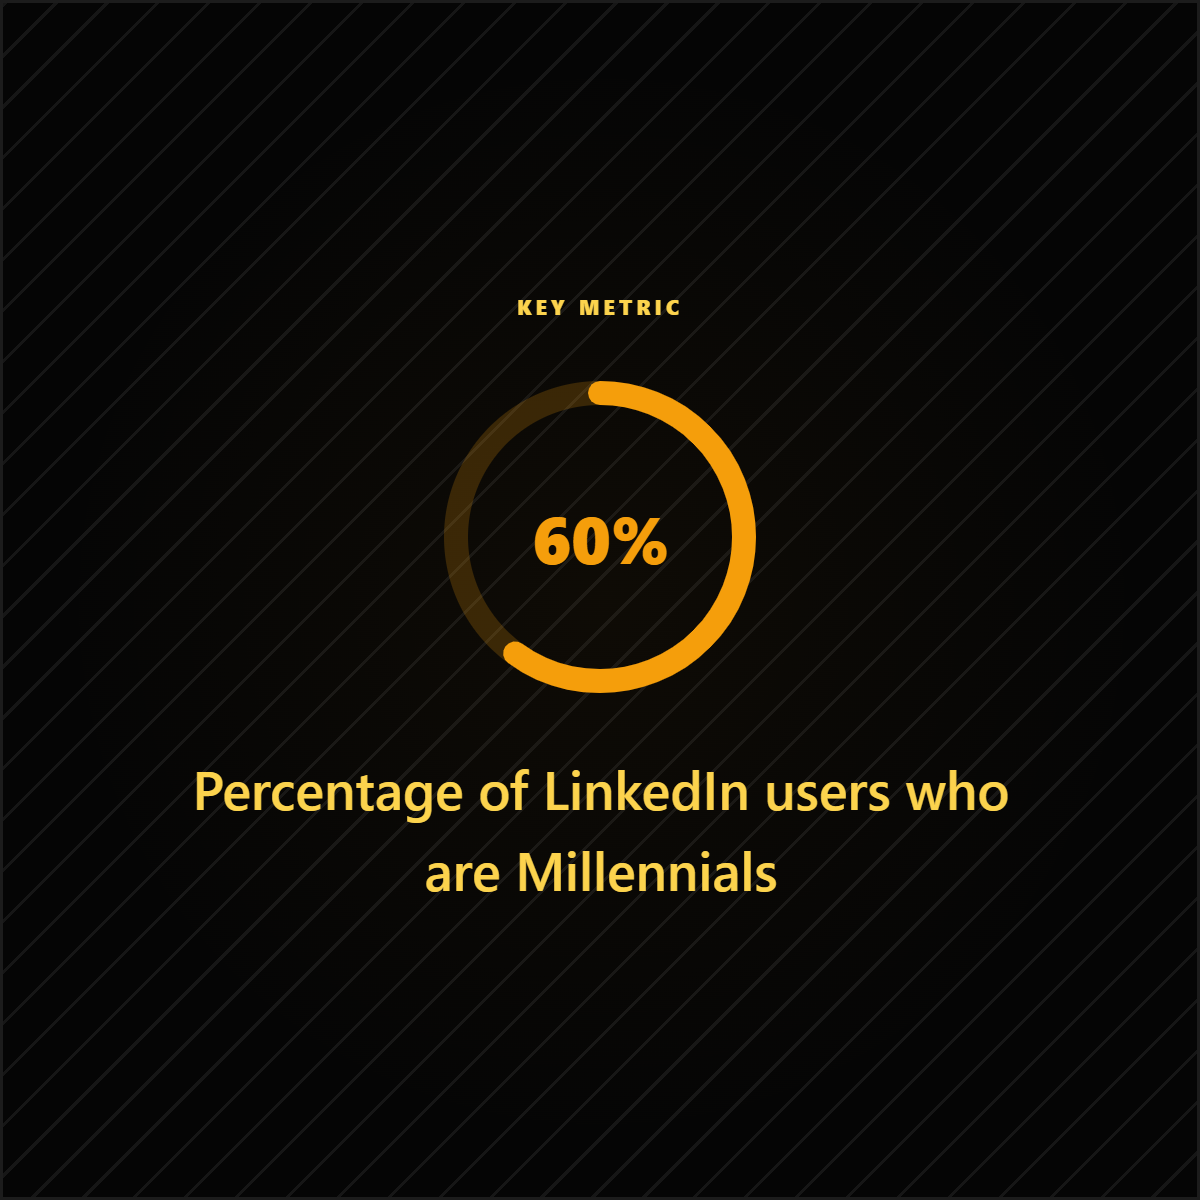
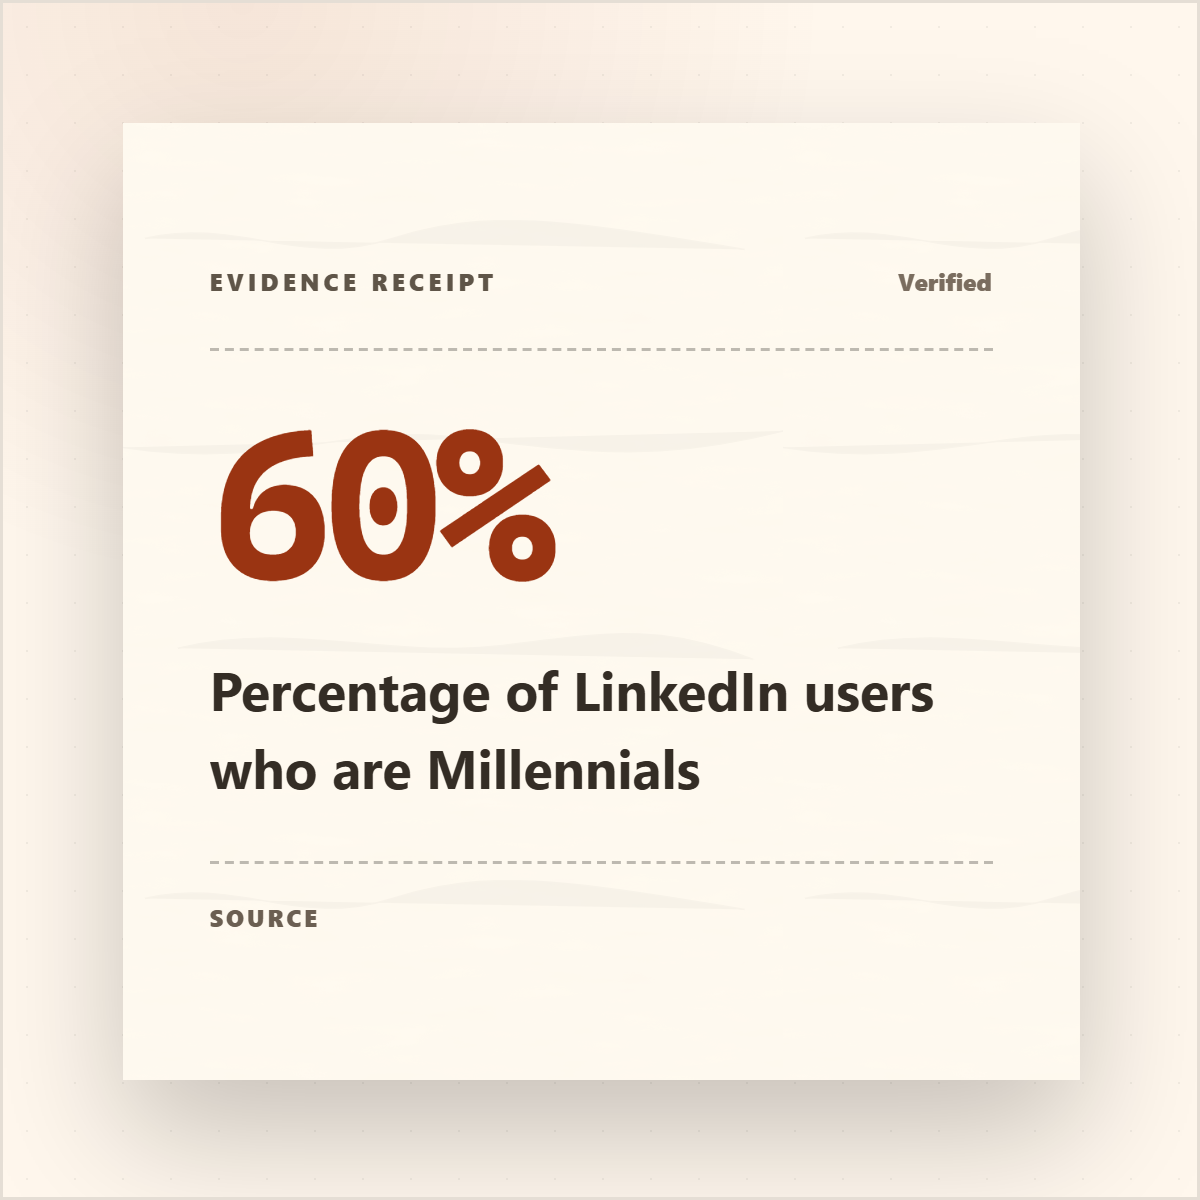
These stat cards show the difference between enlarging a number and turning a report finding into a publishable proof asset.










Best for
- Sharing research findings, market data, survey results, and performance benchmarks.
- Making reports easier to distribute on LinkedIn, X, and Instagram.
- Creating proof-led assets for content marketing and agencies.
Not best for
- Using numbers without the caveats that make them accurate.
- Turning every number in a report into a separate post.
- Presenting estimates as facts without source context.
Manual workflow
- 1Read the report and copy promising statistics.
- 2Check what each statistic actually measures.
- 3Write a short takeaway.
- 4Design the stat card and add source attribution.
Highlightly workflow
- 1Upload a PDF or paste a report URL.
- 2Review extracted statistics, facts, and source metadata.
- 3Choose a stat card, chart card, dashboard card, or briefing visual.
- 4Apply brand styling, edit the takeaway, and export.
Step by step
Choose one number
Pick the statistic that makes the strongest useful point for your audience.
Add context
Include the sample, scope, date, source, or caveat when it affects interpretation.
Design the takeaway
Make the number prominent, but add a sentence that explains why it matters.
Credit the report
Add the source label so the card feels credible and traceable.
Research notes
What this answer is grounded in
Common questions
Can Highlightly extract statistics from reports?
Yes. Highlightly can extract statistics from PDFs, articles, documents, and pasted text, then turn them into stat cards or chart-style visuals.
What makes a stat card credible?
A credible stat card includes the number, a plain-language takeaway, and enough source context for readers to trust it.
Can I make chart-style cards?
Yes. Highlightly supports stat treatments, ranking cards, comparison tables, dashboards, and other visual summary formats.